

THURSDAY’S FORECAST | It’ll look like rain, it’ll feel like rain. Heck, it might even smell like rain. However, it’ll only be spotty showers, with a few embedded downpours today. Tune in to see what your generic phone app won’t tell you about our upcoming weather. Follow my work: www.cupajoe.live Jolt your brand, advertise with me: joe@cupajoe.live
Author: joemartuccillc
-

MUGGY! | Wednesday, 8/13/2025 NJ Weather Forecast
WEDNESDAY’S FORECAST: It’s a muggy, swampy, humid kind of day. It’s much different than that taste of September last week. With all of the moisture in the air, rain will come, but your daytime plans will be fine. Tune in to time out the rain with me and get a sunny look at the weekend!
Follow my work: www.cupajoe.live Jolt your brand, advertise with me: joe@cupajoe.live
-

Hello humidity.. Watching T.S. Erin | Tuesday, 8/12/2025 NJ Weather Forecast
TUESDAY’S FORECAST | After the coldest start to August on record inland, the heat and humidity come back this week. Sorry, hair. In other news, Tropical Storm Erin is running across the Tropical Atlantic Ocean. Tune in and I’ll explain my thoughts on what it means for NJ.
Dominate your fantasy leagues and bets with weather-driven data. MeteoOdds gives you innovative tools, player/game weather impacts, and detailed forecasts. Join FF+ by using the code WEATHER and get 50% off, for life! Turn forecasts into fantasy wins — only at www.meteoodds.com.
-
The incredible proof that the Cape May Bubble really exists!
This column initially appeared in Shore Local Magazine on August 7th
It’s a story that is told often in Cape May County.
You’re out by the water and you see storm clouds to the west. Your weather app on your phone flashes in bright oranges and reds, showing the heavy rain. It’s moving toward Ocean City, or Reeds Beach or Cape May Point.
But as the minutes go by the storm never comes. The radar turns light green, or maybe blank as the rain disappears.
That’s the Cape May Bubble at work, and there’s hard, scientific evidence that it’s a real phenomenon in the area. Compared to the rest of the state, the temperatures, and the number of thunderstorms and snow storms, are simply different here.
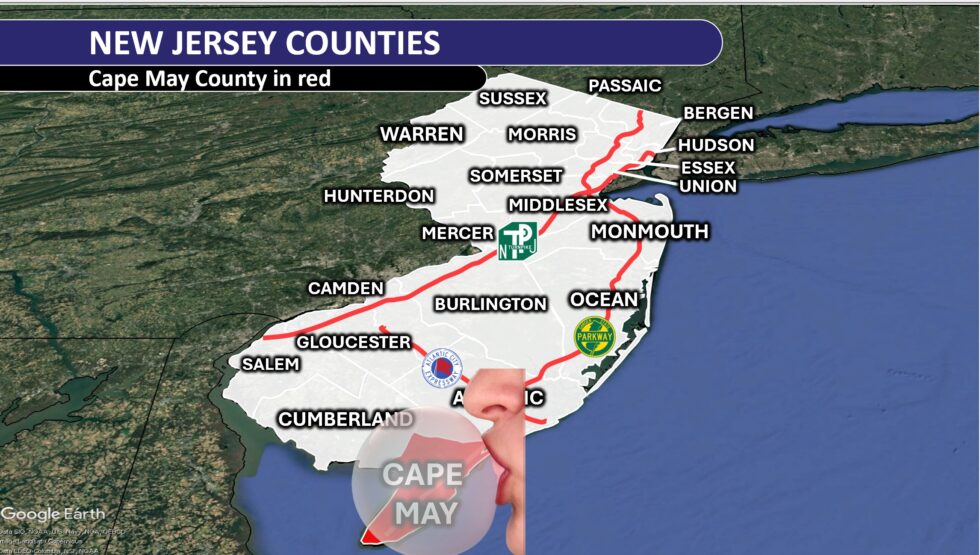
Cape May County geography matters
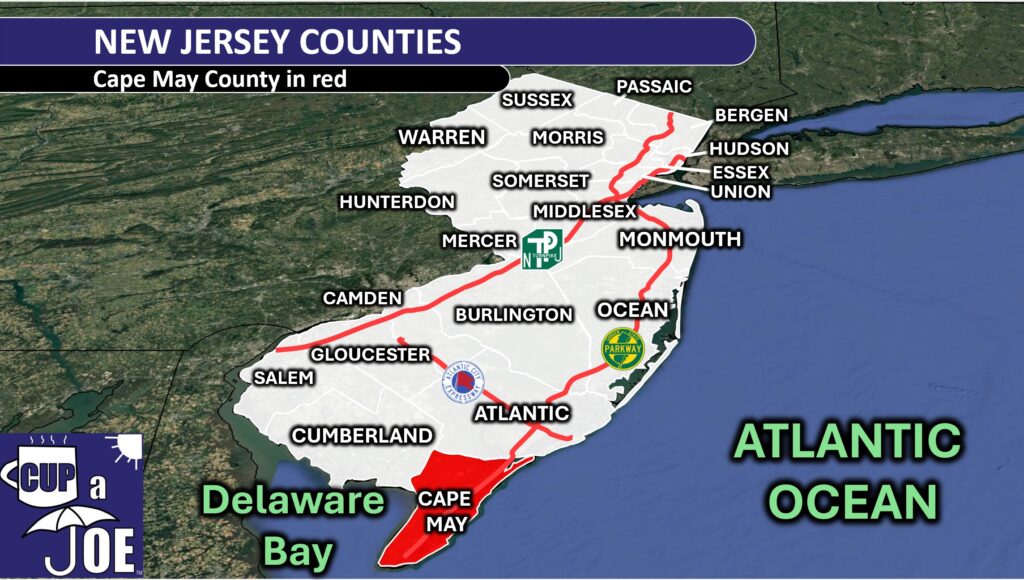
Cape May County is on a peninsula, surrounded by water on all three sides (Delaware Bay to the west, Atlantic Ocean to the south and east). Yes, New Jersey is also technically a peninsula, but the vast bodies of water around our southernmost county drive much of the weather we see.
Water warms and cools more slowly here. For the county, this means that towns stay cooler than most of New Jersey during the spring and summer. The extra water acts like extra air conditioning. Meanwhile, during the fall and winter, the county is milder than the rest of the state. County business leaders know this and over the years built tourism marketing campaigns based on it.
“Fall for the Jersey Cape” is one such slogan used in years past, promoting beach days into October, and plenty of comfortable days to explore the rest of the Jersey Cape. The result helped put Cape May County in second out of New Jersey’s 21 counties for tourism spending from 2021 to 2024, with $8.1 billion spent in 2024, according to the Cape May County Tourism office.
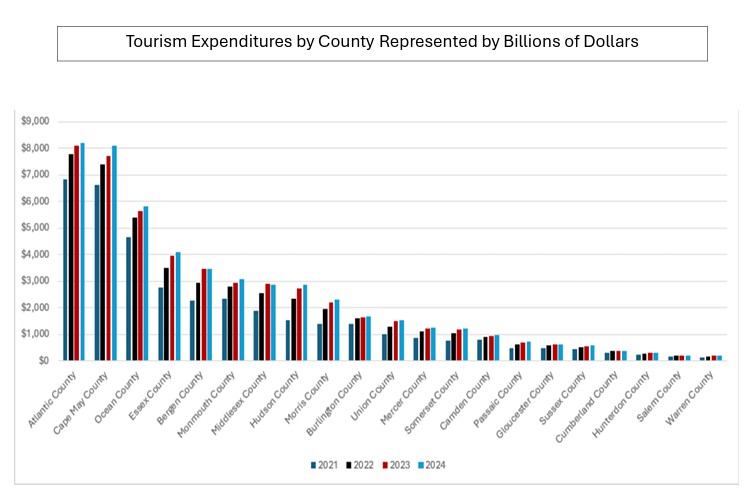
Data via Cape May County Government Between October and March, Cape May’s average temperatures are about 1 degree higher than Atlantic City International Airport in Egg Harbor Township, according to the National Oceanic and Atmospheric Administration. Data shows that Cape May air temperatures stay warmer through May, like the water on the peninsula’s three sides.
By June and July, temperatures in both places level out. In fact, Cape May has cooler high temperatures from around Memorial Day weekend until early August.
Cape May County has fewer thunderstorms
The Cape May Bubble phenomenon I hear about most often is fewer thunderstorms. Turns out, that’s true. Most of New Jersey experiences roughly six hours of heavy rain falling overhead between May and August — peak storm season.
The one exception? The Cape-May-to-Vineland corridor. Only four hours of that type of rain falls here, on average, according to research led by Frédéric Fabry, director of radar observation at McGill University in Canada.
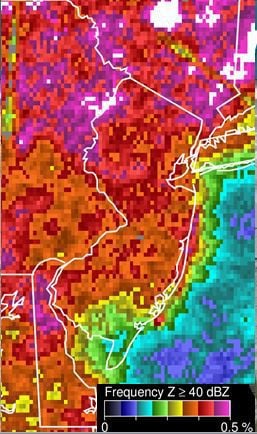
Frequency of radar detecting rain heavy enough to be classified as a thunderstorm during the research period by Fabry et. al. Notice the lower percentages in far southeastern New Jersey than the rest of the state (Via Bulletin of the American Meteorological Society). If storms pass west to east, as they typically do, the relatively cooler Delaware Bay during these months stabilizes the storms, weakening them to below the thunderstorm threshold used in the Fabry’s study. Not only are there fewer thunderstorms, but they occur later in the day, on average.
Cape May County, along with Atlantic and southern Ocean counties, has a preferred thunderstorm time of 6 to 8 p.m. The rest of the state is between 4 and 6 p.m.
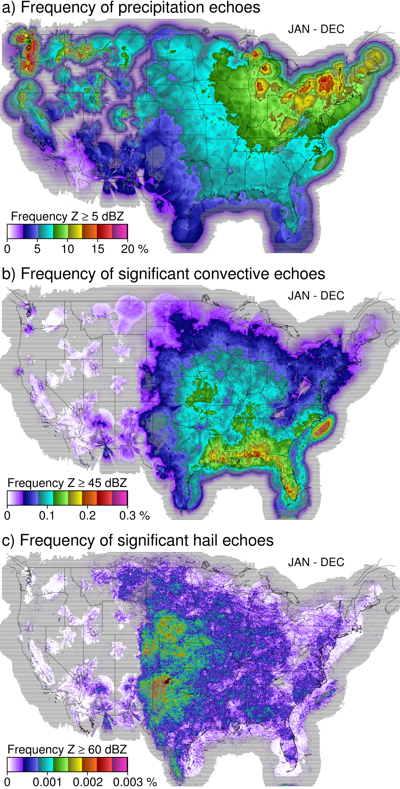
Fabry and his team took all radar scans across the Lower 48 of the United States to detect how many precipitation (A), thunderstorm-heavy rain (B) and hail (C) occurred over any given location. Echoes refer to the intensity of the radar beam that bounces off the precipitation and returns to the radar site. In New Jersey, that is either the radar site at Fort Dix, NJ or Dover Air Force Base, DE. (Image via the Bulletin of the American Meteorological Society) Thunderstorms can happen any time of the day, but fewer and generally later thunderstorms lead to more time outside. That means a healthier South Jersey Shore economy.
There is no scientifically proven reason for this. However, conversations with Fabry and Dave Robinson, the New Jersey State climatologist, in years past suggest that the near daily seabreeze influences the later timing.
The shape of the coastline runs southwest to northeast from Cape May to Long Beach Island. It’s then positioned south to north from Island Beach State Park to Sandy Hook. Furthermore, Cape May County is just more southeast. Storms begin many times during the day on the east side of the Appalachian Mountains. By the time they get to Sea Isle City, it’s later than the time they got to Philadelphia.
Cape May County has less rain
The southern (or lower) part of Cape May County is also among the driest in the state. Here’s a look at the average annual precipitation for our major weather reporting stations.
- Lower Township, Cape May County: 43.84 inches
- Atlantic City, Atlantic County: 43.62 inches
- Egg Harbor Township, Atlantic County: 45.96 inches
- Long Branch, Monmouth County: 52.53 inches
- Trenton, Mercer County: 45.63 inches
- Newark, Essex County: 46.60 inches
- Belvidere, Warren County: 48.21 inches
Average annual precipitation in New Jersey in the year 2000. While the annual precipitation is slightly different in 2025, Cape May County still remains the driest place in the state on any given year (Via Oregon State University). The reason, in part, for the drier weather is the water being on three sides.
Seabreeze fronts are common here from March to August. Once the seabreeze front passes from the coastline, inland, the air is more stable. That means it’s less likely to rain.
Furthermore, Cape May County is the county farthest removed from the process known as upsloping, which brings rain to the foothills of mountains. In this case, that’s the Appalachian Mountains.
Cape May County has less snow
Cape May County is the state’s flattest and southernmost county. Therefore, having the least amount of snow just comes with the territory. The long-standing Cooperative Observer Station in Lower Township averages 14.8 inches of snow in a year.
From December to March, snow season, the water temperature in Cape May Harbor is between 39 and 45 degrees, according to the National Oceanic and Atmospheric Administration. Nor’easters, and the northeast winds they bring, funnel this above-freezing ocean air into the county. How many times has Trenton or Hammonton been covered in 6 inches of snow, while Marmora or Ocean City barely has a flake? The relatively mild water is the reason.
Are there other bubbles in New Jersey?
Given the data, you can make the case that the Cape May Bubble is really an Atlantic City Bubble, a Somers Point Bubble and a Millville Bubble. This far southeastern corner of New Jersey experiences different weather than the rest of the state.
I had the opportunity to meet Fabry at the American Meteorological Society conference in Baltimore in January 2024. He still remembers when we first talked about the phenomenon in 2019. He was kind and laughed when I explained just how much people talk about the bubble down here.

The man who proved the Cape May Bubble is real, Frederic Fabry, along with myself at the 2024 American Meteorological Society Annual Meeting in Baltimore, MD. Given Quebec’s deep-rooted history with tourism in Cape May County, it might be time we welcome him for a visit. Expect the storms to stay away if he comes.
Joe Martucci, a Certified Broadcast Meteorologist and Digital Meteorologist, is the President and Director of Meteorology for Cup A Joe Weather and Drone. You can connect with him at cupajoe.sparkable.opalstacked.com/.
-

Picture-Perfect! Saturday, 8/9/2025 NJ Weather Forecast
SATURDAY’S FORECAST | Happy Full Sturgeon Moon day! Nothing crazy about this weather, though. It’s picture-perfect and feeling more like September. Just avoid being in the ocean and you’ll be fine.
Follow my work: www.cupajoe.live
Jolt your brand, advertise with me: joe@cupajoe.live -

ROUGH seas, BEAUTIFUL on land | Friday, 8/8/2025 NJ Weather Forecast
FRIDAY’S FORECAST | It’s a comfortably cool day today! High temperatures will go for 75-80F. However, that ocean is rough and rowdy. Hit the bay if you want a place to swim today. Otherwise, I think you’ll like this weekend forecast!
Captain’s Tree Service handles all your tree needs, including tree removals, trimming, pruning, and 24/7 emergency care. They’re reliable, affordable, and trusted by families. Call the Captain today for a free estimate at (856) 883-7682!
-

REPEAT of yesterday | Wednesday, 8/6/2025 NJ Weather Forecast
Take Tuesday, hit copy and paste it right it right into Wednesday. That means more hazy sky from the wildfire smoke, more clouds but comfortable air, too. Changes are on the way later this week! Let’s talk about your 7 day forecast.
Follow my work: www.cupajoe.live
Jolt your brand, advertise with me: joe@cupajoe.live
-

‘They were heroes.’ Avalon Beach Patrol rescues 10 as sailboat sinks
News 12 did an excellent job covering the dramatic rescue of 10 people as a sailboat sank off of Avalon on July 25. Tom Kronsowski had me on to discuss the water and weather conditions that led to the rescue.
WATCH HERE: https://newjersey.news12.com/they-were-heroes-avalon-beach-patrol-rescues-10-as-sailboat-sinks
-
NJ ocean’s warm – the direct opposite of last summer
This article initially appeared in Shore Local magazine on July 31
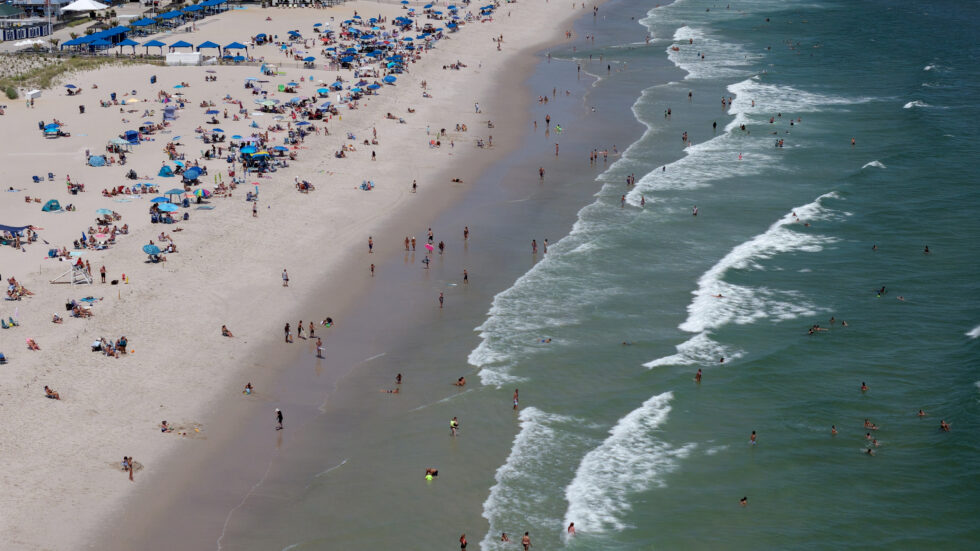
Despite some stormy and cool weekends this summer, there’s one thing we can say about the Jersey Shore right now: “Come on in; the water’s warm!”
The ocean water has been above average for most of the summer so far. According to the National Oceanic and Atmospheric Administration, 75-degree water temperatures were recorded off the Steel Pier in Atlantic City on July 5, 6, 8, 12-17, and 23-28. In other words, over half of the July days, the ocean water temperature was warm. That’s more like South Carolina than South Jersey.
It’s the complete opposite of last summer. June and July had zero days with a water temperature above 75 degrees. In fact, 11 July days were in the very chilly 50s, and 55 degrees was the 8 a.m. water temperature on July 18, 2024. Getting in the ocean was tough.
To explain why summer 2025 has been an absolute warm ocean lover’s delight, I’ll use another mantra: “Life’s at ease with an ocean breeze.”
Wind direction determines ocean water temperature
Ranking behind the strength of the warming sun and the currents, the direction of the wind plays the biggest role in water temperatures in New Jersey. In fact, it’s the main player for the day-to-day, or hour-to-hour variations.
Cooler ocean waters are caused by upwelling. Upwelling describes what happens when the typically warmer sea surface water moves away from the coast and out to sea. Colder water from the sea floor then rises to the top along the shoreline.
This is a critical part of our marine ecosystem. That cold water is nutrient-rich and keeps our living ocean alive.
Upwelling is caused by Ekman Spiraling, according to the American Meteorological Society’s glossary.
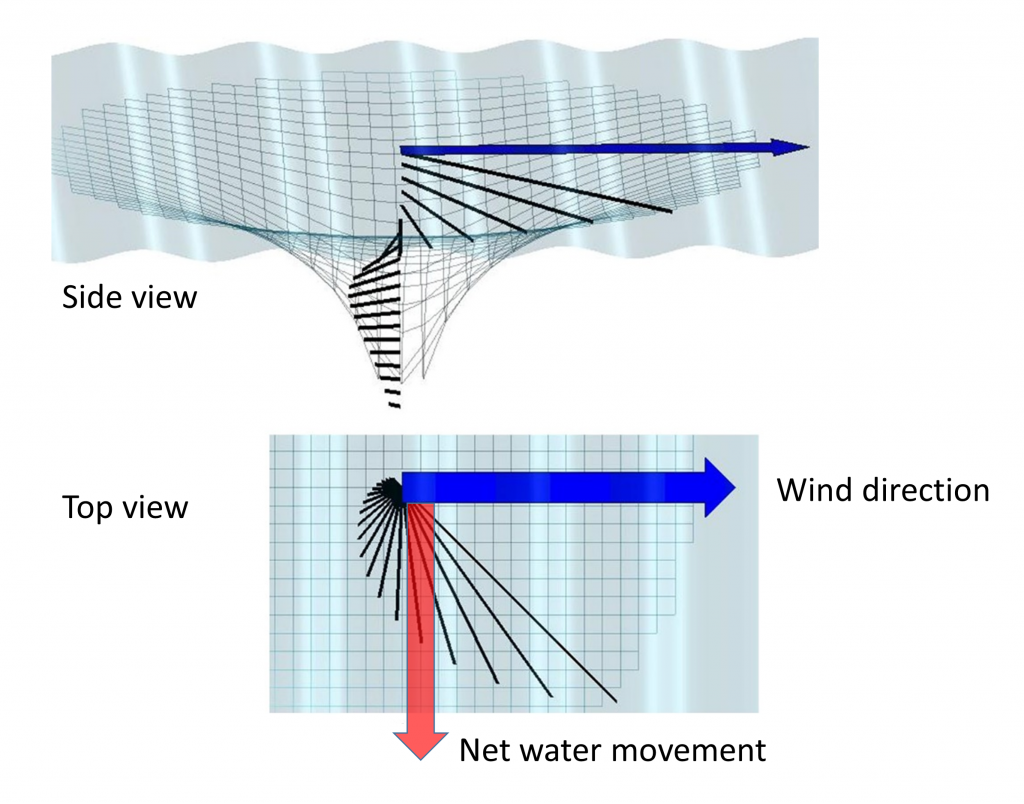
A look at how Ekman spiral works. Notice the lower image. The water will move to the right of the direction of the wind. In New Jersey, that means a south wind will push the warmer, near surface ocean water away. I’ll save the meteorology for you, but for the Jersey Shore, and the Northern Hemisphere, upwelling occurs any time the coastline is to the left of the direction of the wind. In our case it means a wind from the southwest or south. The Jersey Shore is to the left of the air current. That causes Ekman Spiraling, which pushes that warm water away.
On the other hand, warmer water gets pushed onshore with onshore winds. A wind from the southeast, east or even northeast will blow warmer-than-usual water in from the Gulf Stream our way.
From the time climatological summer began on June 1, to July 28, winds were out of the favorable southeast, east and northeast direction 30% of the time at Atlantic City International Airport in Egg Harbor Township, according to the Iowa Environmental Mesonet. Yes, the airport is inland, but the large-scale wind measurement known as synoptic wind direction, is usually the same between the airport and the coast itself.
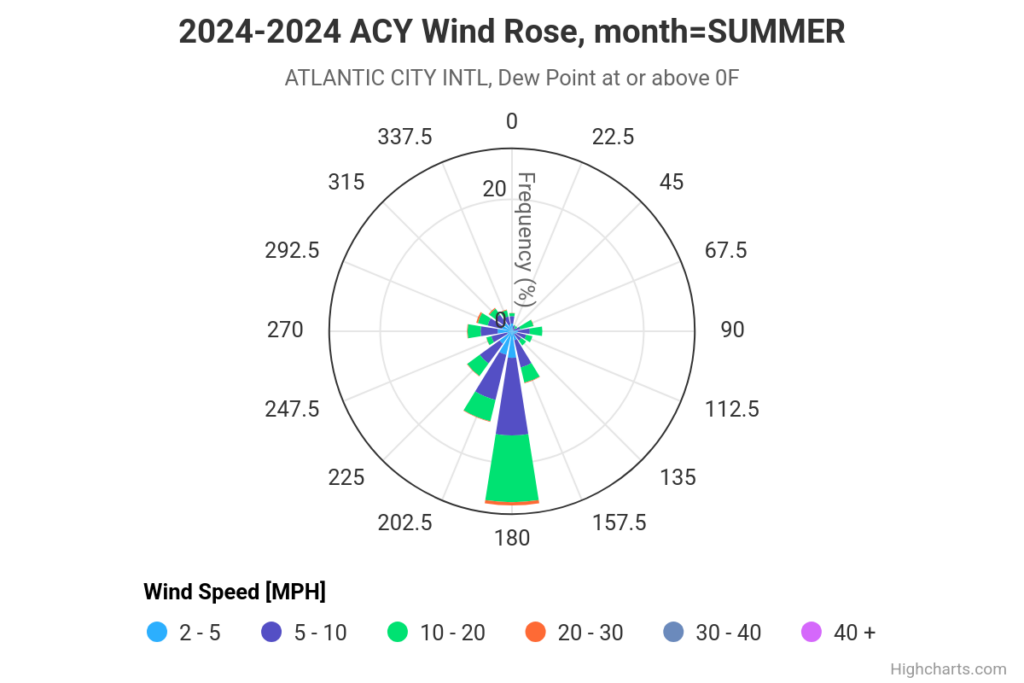
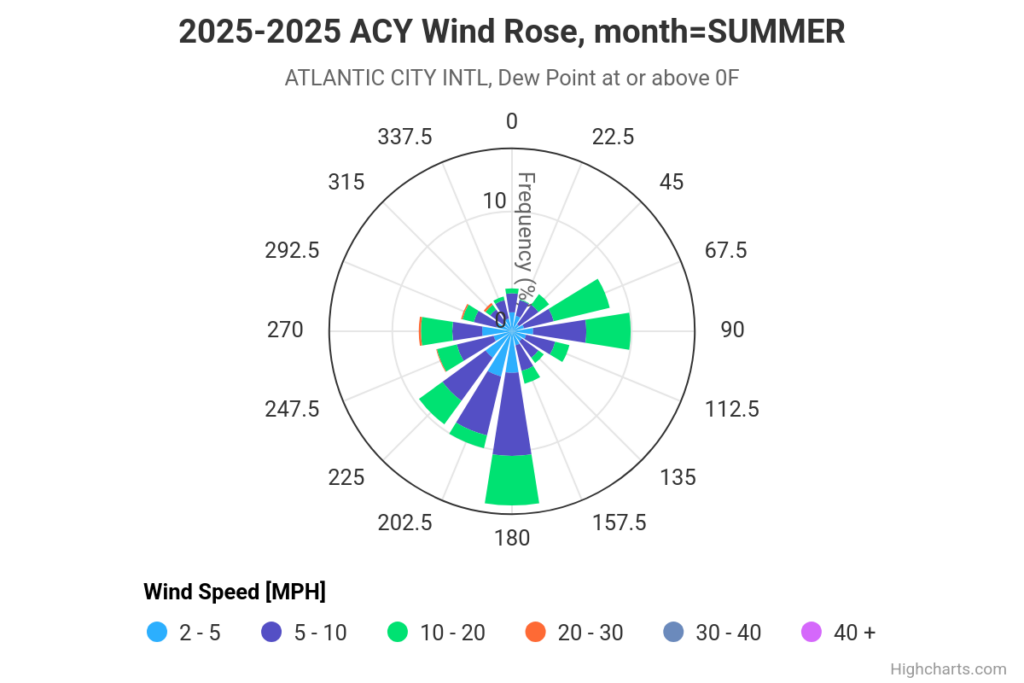
During summer of 2024, winds blew from the southeast, east to northeast just 12% of the time. During the summer of 2025, it has been above the long-term average of roughly 20%.
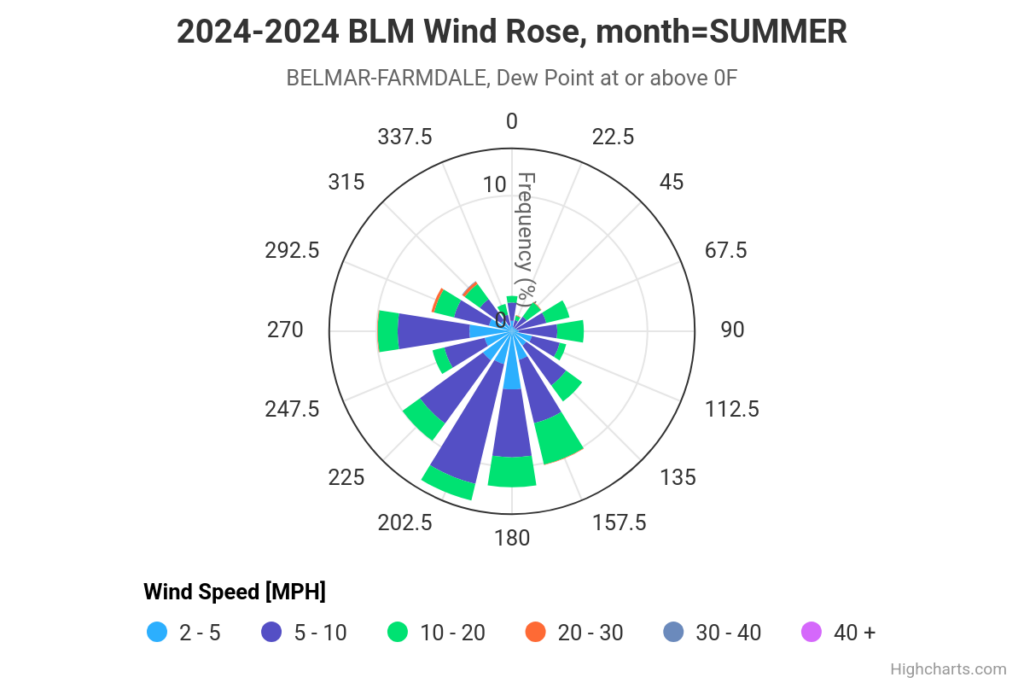
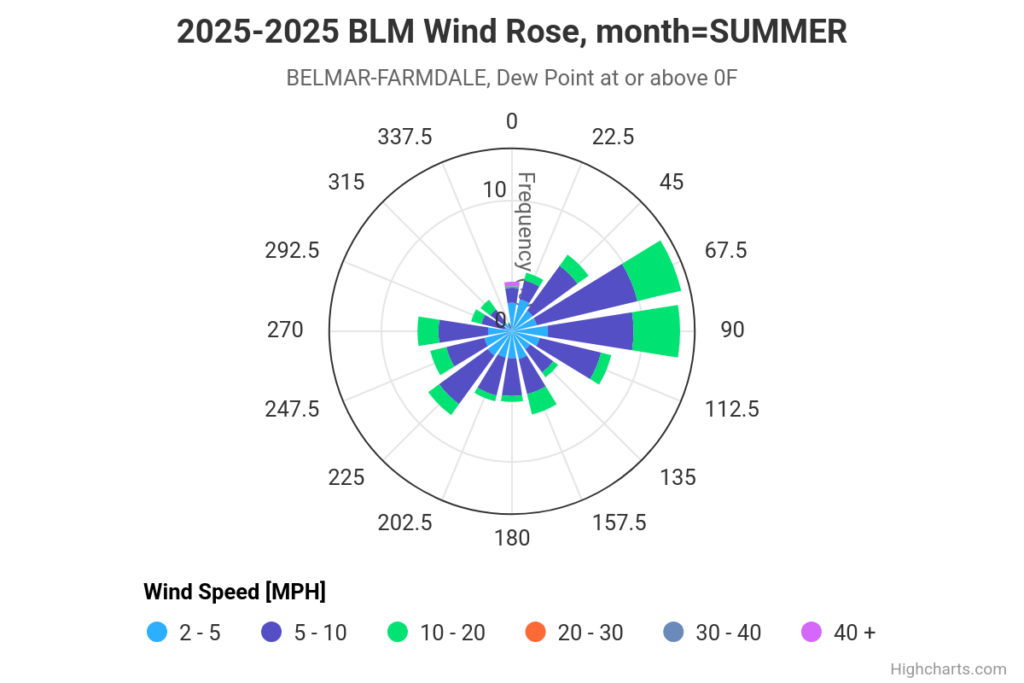
Go up the coast and you have had the same results only more often. Readings at Monmouth County Executive Airport in Wall show wind direction out of the southeast, east or northeast a whopping 55% of the time through July 28, according to the Mesonet. Last summer it was about 30%.
Eighty-degree ocean water is possible come August
Offshore winds should continue to be a focal point of the August forecast, and with the climatological peak of our ocean waters coming at the end of the month, a few 80-degree ocean water temperatures are very possible.
While I’m not as keen on it as I was in our Halfway Through Summer Outlook column a few weeks ago, there is still a better-than-50% chance that the wind direction comes from the southeast, east or northeast more than average during August.
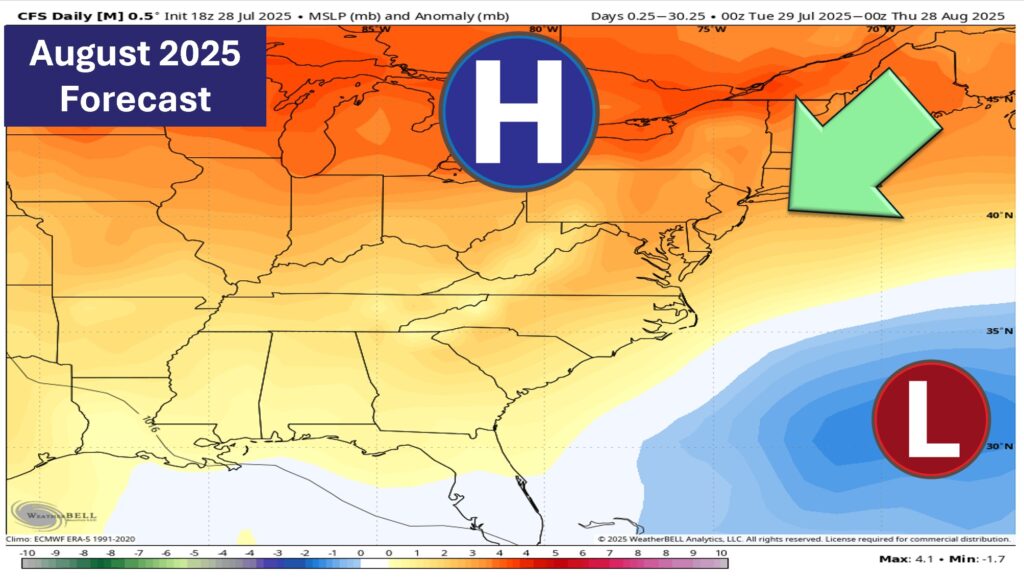
August 2025 computer model sea level pressure forecast. Northeast winds are expected more than usual in August, bringing in relatively cooler air (via www.tropicaltidbits.com) We average at least one day with a water temperature at or above 80 degrees at the Atlantic City station in August. So, hitting 80 is not unusual. However, given the constant 70s we’ve had up and down the coast so far, more onshore winds would likely give us at least a few days in the tropical 80s.
Shore summer weekend weather report card update
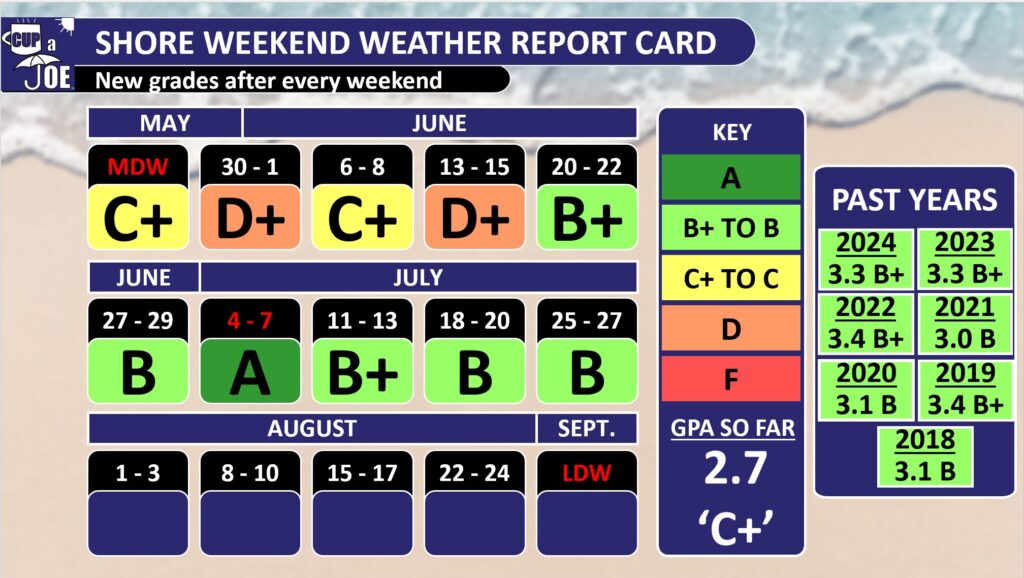
The report card’s been holding its own over the month of July. However, summer 2025 will need to study hard, put in the work and give us beautiful, dry weekends for August in order to keep this summer out of last place.
I graded the July 25-27 weekend a ‘B.’ That brings the grade point average since Memorial Day Weekend to a 2.7 – right around a B-minus.
In the eight summers that I’ve graded the weekend weather, the lowest final grade point average was a 3.0 back in 2021.
Climatologically, our weather becomes less rainy in mid-August. So, there’s still time to earn a few ‘A’ grades and dig out of last place.
Joe Martucci, a Certified Broadcast Meteorologist and Digital Meteorologist, is the President and Director of Meteorology for Cup A Joe Weather and Drone. You can connect with him at cupajoe.sparkable.opalstacked.com/.
-

7/29/2025 NJ Heat Wave Interview with NJ Spotlight News
Thanks to NJ Spotlight News for having me on to discuss this heat wave in NJ. It’s our 5th heat wave in Newark, 3rd in Trenton and 2nd in Egg Harbor Twp. It’s hot! Find me around 2:00.