
FRIDAY’S FORECAST: For the second day in a row, snow kicked off our day at the Jersey Shore! We’ll be dry for the rest of Friday but this polar express continues. One thing your generic weather app won’t tell you? How it could snow Saturday night.
Our 24×7 Jersey Shore Weather Channel: erse
Jolt your brand, advertise here: joe@cupajoe.live
Tag: meteorology
-

Friday SNOW starts our day… again! 1 more snow this weekend?
-

The Jersey Shore’s Top 10 Weather Events of 2025
This article initally appeared in Shore Local magazine on Dec. 30, 2025
A variety of weather and near weather events grace my Jersey Shore top 10 events of 2025 list. However, there are two notable absences.
Snow did not make my list, at least not directly. The snow on Dec. 14 did peak at the Jersey Shore, but the highest totals were only in northern Ocean and Monmouth County. Feb. 11-12 was the opposite. Atlantic and Cape May counties picked up five to nine inches of snow. The northern part of the shore had less, while typically snowy Sussex County barely had a flake. There was no unifying Jersey Shore storm like the blizzard of 2022.
Also absent is yearly warmth. For the first time since 2014, the Jersey Shore will fall outside of the top 20 for hottest years since reliable records began in 1895, according to Dave Robinson, the New Jersey State Climatologist, while also my “weather dad” and May 13 birthday buddy.
However, a stretch of extremely hot days did make the top 10, so did muggy weather, severe weather, frigid weather, nor’easters, tropical systems, among other things.
Note that the data below is from the National Oceanic and Atmospheric Administration, unless written otherwise.
Let’s get into it.
10) Fortescue’s stifling high dew point on July 25
Fortescue juts out into the Delaware Bay in Cumberland County, allowing the sometimes very warm water to come onto the marshy land. Bay waters in the 80s paired with a very sultry wind from the Deep South brought the dew point to an astounding 88 degrees at 4 and 5 p.m. that day. That makes for extremely uncomfortable heat indices:
2 p.m.: 106 degrees
3 p.m.: 112 degrees
4 p.m.: 121 degrees
5 p.m.: 118 degrees
6 p.m.: 120 degrees
7 p.m.: 118 degrees
8 p.m.: 109 degrees,
9 p.m.: 97 degrees.
A heat index of 109 degrees at 8 p.m. here is rare. A 121-degree heat index maybe happens three times a year in New Jersey, and it’s only for one town.
Most places in New Jersey never experienced a dew point that high in their record. So, while this only happened in one small community, its impact is might enough to be number 10.
9) Severe heat to severe weather on July 25
Inland high temperatures were as high as 100 degrees (Toms River) with everyone else in the mid to upper 90s. Couple that with high dew points and it was sweltering in the sun.
As is often the case, though, big-time heat means big time thunderstorms.
During the evening, a cold front pushed in from the northwest. The result was a line of thunderstorms that brought many downed trees and powerlines to Ocean and Monmouth counties. Beach Haven, in Long Beach Island had a waterspout. Further north, Seaside Park registered a wind gust of 66 mph.
8) White Christmas drought continues
For the fifteenth year in a row, most of the Jersey Shore went without a White Christmas, the longest on record. Officially, a definition of a White Christmas is at least one inch or snow on the ground Christmas morning. Here were the last White Christmases, by location.
Atlantic City International Airport: 2009
Long Branch, Monmouth County: 2009
Lower Township, Cape May County: 2000
Well inland parts of the northern coastal counties did have a White Christmas in 2024 but for most of our area, it’s been a while. Sorry, Santa.
7) Impressive late winter cold
February 18-20 was the latest three-day streak of sub-freezing temperatures in decades.
At Atlantic City International Airport, Sen. Frank S. Farley State Marina in Atlantic City and Lower Township, the last time this happened this late or later in winter was in 1993.
ACY airport and Long Branch were below 30 degrees all three days. That hasn’t happened since 1980, at the very end of February and beginning of March.
6) June 21-25 Heat Wave
We just went from one of the latest cold snaps on record to one of the earliest streaks of 100-degree heat.
At Atlantic City International Airport, the temperature hit a hot 102 degrees on two days in a row, June 24 and June 25. The last time the airport had two days in a row reaching 100 degrees or higher was during the big heat wave in July 2011. These 100-degree days were the third earliest on record. When looking only at days that reached 102 degrees, they were the second earliest.
Of course, those two days broke the daily records for June 24 and 25. The airport also set a daily record on June 23 with 98 degrees.
Even the beaches felt the heat. At the Atlantic City Marina, June 23 was the first day of 90 degrees since 2022, reaching 93 degrees and breaking a daily record. Two days later, it tied another record high at 95 degrees.
During the six-day heat wave from June 21 to 26, both the airport and the marina set records for the warmest low temperatures at night.
5) October 12-13 Nor’easter
This is the first of two big tidal flooding events of the year.
Powerful onshore winds stacked the bays, bringing flooding conditions to five consecutive high tides. In the back bays, the constant onshore wind prevented the salt water from fully draining out before the next high tide.
Waretown, Ocean County, reported its highest tide on record. That being said, records only go back to 2018. Several gauges reported top 10 tidal heights since at least the year 2000. Numerous roads were closed due to tidal flooding and places that do not usually have tidal flooding did.
The most northern Jersey Shore town, Sea Bright, had 18 occupants removed from 12 flooded vehicles on Ocean Avenue, the only main road in town.
Atlantic City, Harvey Cedars, Little Egg Harbor and Seaside Heights had gusts over 50 mph on both Oct. 12 and 13. Sea Girt gusted to 51 mph on Oct. 13. Even Oct. 13 gusted over 40 mph in a few beach towns.
Six of the 81 beaches inspected by the New Jersey Department of Environmental Protection had major erosion. Another eight had moderate erosion.
4) Whipping Winter Winds
I cheated for this one, but since the strongest winds were after December 2024, I’ll count it for 2025.
The average December-March wind speed at Atlantic City International Airport and Ocean County airport was the highest since the winter of 2010-2011. Lower Township had the breeziest wind since 2017-2018.
Bad hair days and frigid faces were common all winter long. January 2025 had 16 days with gusts over 40 mph somewhere within the New Jersey Weather Network stations, run by Robinson and the state climate office. That was a record high for the network
The winter also was the most or was tied for the greatest number of wind advisory for 46-57 mph wind gusts for Atlantic and Cape May counties since we started keeping track in 2006.
A few days were extremely windy.
Feb. 16-17: ACY Airport had the second highest wintertime gust on record, since 1943. It clocked in at 71 mph. Most shore counties gusted over 45 mph. Over 200,000 thousand people were without power throughout the state.
March 5-7: Winds gusted over 50 mph in Fortescue and Woodbine, with many others in the 40s.
People have asked me for years if it’s been windier at the Jersey Shore in recent years. While it’s a hard sell after this winter, the answer is still no, it’s not gotten windier.
3) Hurricane Erin August 20-22
This is probably the most significant hurricane with virtually no meaningful rainfall in the shore’s history. Hurricane Erin’s eye always stayed at least 400 miles away. Yet, the following happened Let’s go through the stats:
The highest summertime tide on record for Atlantic City, Absecon, Sea Isle City, Stone Harbor, Cape May (bayside).
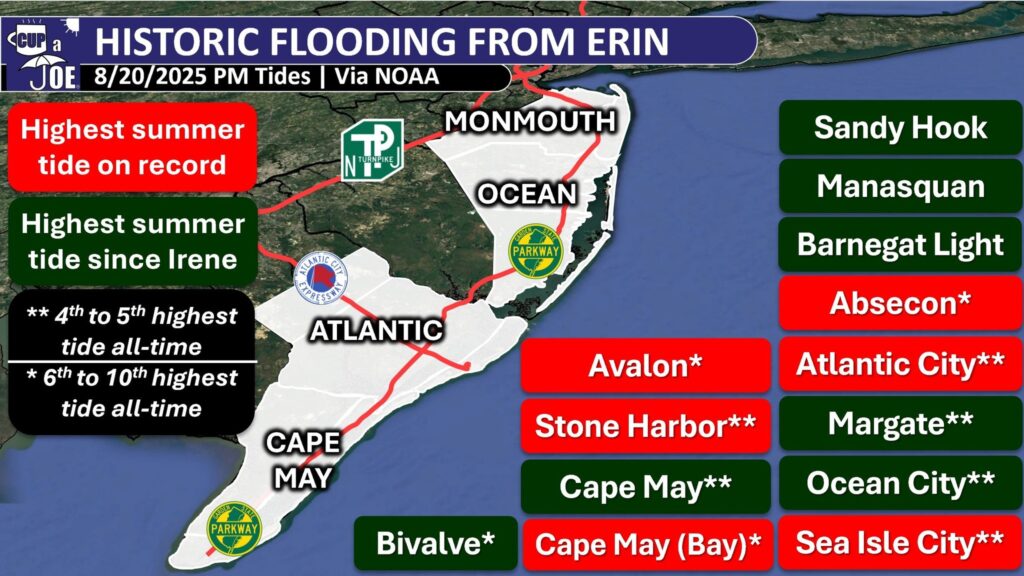
The highest summertime tide since Tropical Storm Irene in 2011 for virtually every other tidal station on the Jersey Shore.
Closed beaches on Aug. 20, 21 and 22. 50 water rescues due to tidal flooding in Margate.
Water rescues on the Black Horse Pike and White Horse Pike between Atlantic City and the mainland.
Ocean wave heights of 10 to 15 feet.
Wave periods at an extremely long 15 seconds or more.
Nine beaches had moderate beach or dune erosion.
Thankfully, no deaths from the high surf and rip currents occurred.
While many of us typically associate hurricane season in New Jersey in September and October, this was a good reminder that hurricane season runs during our busiest time of the year at the coast, the summer.
2) The April Jones Road Fire
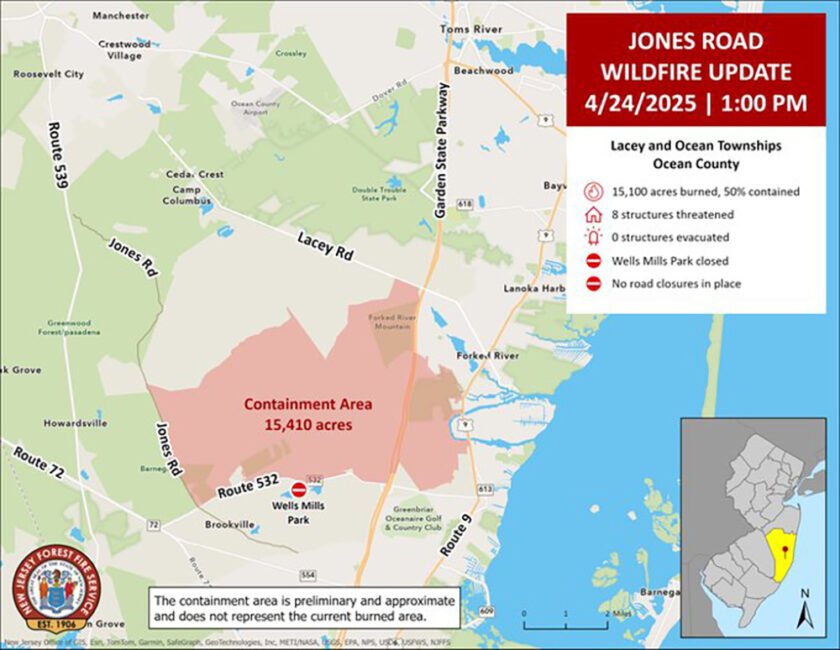
Via NJ Forest Fire Service The Jones Road Fire, which was first spotted at 9:45 a.m. on April 22, was the fourteenth largest fire in the state’s period of record. It swallowed up 23 square miles in Ocean County, or a little over 15,000 acres, according to the NJDEP.
It started on April 22, 2025, from a bonfire that two teenagers did not put out all the way. Dry weather, strong winds, and low humidity helped the fire spread quickly.
Thousands of people had to leave their homes for safety, the Garden State Parkway closed, and smoke made the air bad even in New York City.
One commercial building and some outbuildings were destroyed, but no homes were lost and no one was hurt. Firefighters worked hard and stopped the fire completely on May 12, 2025.
From Jan. 1 to April 25, 662 wildfires occurred in New Jersey.
Last year through April 25, about half as many wildfires occurred.
The difference was drought. When the Jones Road Fire began, that area was in a transitionary state between drought and no drought, known as abnormally dry conditions, according to the United States Drought Monitor.
1) Drought
The Jones Road Fire was caused, in part by the drought. The first four months of 2025 continued the significant drought that ramped up severely during the driest Fall on record in 2024.
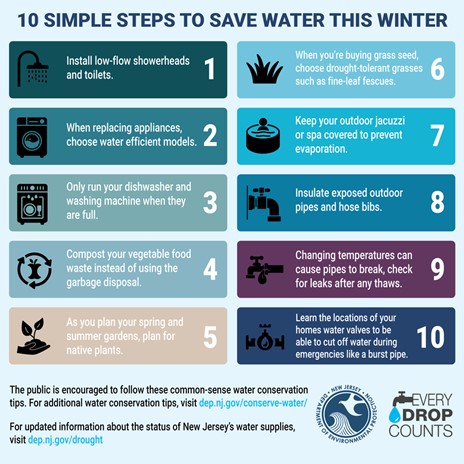
Voluntary water restrictions were in place. New Jersey American Water urged customers to reduce water usage.
Via NJ Department of Environmental Protection The United States Drought Monitor had at least part of the Jersey Shore in one of the four stages of drought until May 20. An ‘extreme drought,’ the second highest level of drought gripped Ocean County south to Cape May until early March.
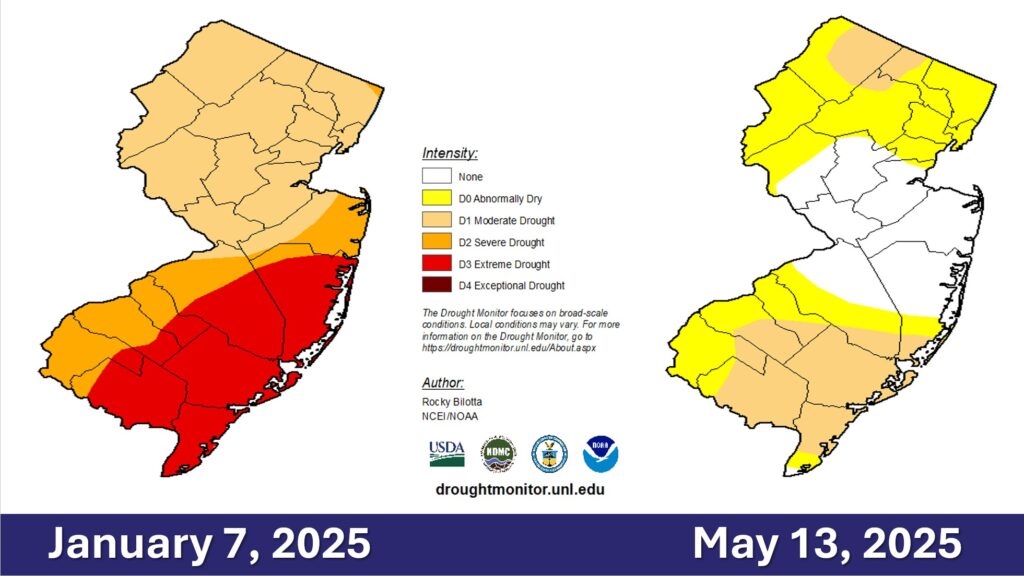
Via the United States Drought Monitor Groundwater from the Kirkwood-Cohansey aquifer in the southern half of the shore counties was ‘extremely dry” through May. Streamflows at the Jersey Shore were ‘extremely dry’ for 32 weeks in a row to start off the year.
The NJDEP continued the Drought Warning in the state on June 11. Even then, Cape May, Atlantic and most of Ocean counties were downgraded just to a Drought Watch, instead of normal conditions like the rest of the state.
The fifth wettest May on record dating back to 1895 busted the drought. However, it was only temporary.
A Drought Warning returned to the state on Dec. 5. Voluntary water restrictions are in place. Extremely dry streamflows and groundwaters returned during the Fall for most of the Jersey Shore. Most of Cape May County joins the western half of the state in drought according to the United States Drought Monitor.
More than likely, December will wind up drier than average across the coastal counties. That puts a lot of pressure on January and February to have more precipitation than average.
If not, more fires like the Jones Road one threatens going into Spring.
Finally…
Dave Robinson, the state climatologist, and I will compare our top weather events of the year during our Monthly Weather Roundup. Look for that on the Cup A Joe Weather and Drone website as well as social media channels on Dec. 30.
He put the October nor’easter above Hurricane Erin, but our number one and two events are the same. What do you think of the list? Leave me a note.
Have a fun, safe New Year. Looking forward to sharing more with you on Shore Local in 2026.
-

Winds continue to howl Tuesday in NJ, snow to start 2026?
TUESDAY’S FORECAST: Winds continue to whip this morning! 60 mph was the top mark in Avalon and Highlands. A wind advisory remain in effect. Once the winds calm, though, a few snow showers are in the forecast! It could ring in 2026, too.
Our 24×7 Jersey Shore Weather Channel: https://youtube.com/live/TR-MhfoZKuw
Jolt your brand, advertise here: joe@cupajoe.live -

KING NAM?! What really happened in Friday night’s underwhelming NJ storm
👑 King… NAM? The NAM weather model nailed Friday night’s underwhelming storm 3 days ago! However, this was an Alberta Clipper. It never was going to have enough juice. Here’s what happened.
Our 24×7 Jersey Shore Weather Channel: https://youtube.com/live/TR-MhfoZKuw
Jolt your brand, advertise here: joe@cupajoe.live -

ICE is an issue at the Jersey Shore Saturday morning. What’s next?
SATURDAY AM FORECAST: Ok, the snow/sleet totals we put out didn’t come true. Sorry. However, like we said a few times, the dangerous driving and power outages impacts were going to be the same even if it was all sleet. That came true. 2,200 people are without power in Manchester right now. Tune in.
Our 24×7 Jersey Shore Weather Channel: https://youtube.com/live/TR-MhfoZKuw
Jolt your brand, advertise here: joe@cupajoe.live -
The difference between the winter storm warning and winter weather advisory for Friday night’s storm.
❄ Here’s what those Winter Storm Warnings and Winter Weather Advisories you’re in mean.. Think watch first.. Then Warning or Advisory!
Dec. 26 Storm Forecast: https://cupajoe.sparkable.opalstacked.com/nj-winter-storm-update-friday-dec-26/
-

TIGHT snow-sleet-rain gradient expected in NJ Friday. Here are my changes.
FRIDAY MORNING UPDATE: The snow-sleet-rain map is updated and there are changes, so take a look! There’s going to be a tight gradient between wintry weather and rain for part of the Jersey Shore. Meanwhile, far North Jersey will see 7″-11″ of snow. Let’s talking travel impacts, timing and more.
Follow my work: www.cupajoe.live
Jolt your brand, advertise with me: joe@cupajoe.live -

Winter storm WATCH in effect Friday – Saturday for parts of the Jersey Shore
CHRISTMAS FORECAST: Merry Christmas to everyone celebrating! The weather doesn’t stop and neither do we. We have your full forecast on the winter storm to come Friday evening to Saturday. Something your generic weather app won’t tell you? How post-Christmas travel will be impacted.
Never worry about missing severe weather warnings again. Get a recorded call from me when your location is impacted. WeatherCall ensures you stay informed for just $15 a year. Sign up: https://ngorder.wxriskalerts.com/db_app2.php?station=cajx
-

WINTRY MESS! First look NJ snow forecast for Friday night – Saturday system.
WEDNESDAY’S FORECAST | It’s merry and bright for Christmas Eve but that’ll change. A winter storm is on for Kwanzaa and Boxing Day and this will bring an ol’ fashioned slop fest to the Jersey Shore. Snow, sleet, freezing rain and rain will be around. Here’s what I know so far.
Follow my work: www.cupajoe.live
Jolt your brand, advertise with me: joe@cupajoe.live -

America just developed 3 AI forecast weather models, including 1 bold new one
Following in the footsteps of the European weather community, Google, and others, the National Oceanic and Atmospheric Administration (NOAA) has entered the artificial intelligence weather forecast model arms race, and it may have done enough to become the leader.
The government agency, responsible for the National Weather Service and the authority for weather alerts in this country, released three different AI models in a press release on Dec. 17.
“NOAA’s strategic application of AI is a significant leap forward in American weather model innovation,” said Neil Jacobs, NOAA administrator. “These AI models reflect a new paradigm for NOAA in providing improved accuracy for large-scale weather and tropical tracks, and faster delivery of forecast products to meteorologists and the public at a lower cost through drastically reduced computational expenses.”
Until now, if I wanted to use an American weather forecast model that is publicly accessible, I would use a physics-based model like the Global Forecast System, or the High-Resolution Rapid Refresh model. In short, it takes the current and recent state of the atmosphere, and runs it into a long math equation. The solution is generated and then we turn it into pretty graphics.
The AI models are different. They also take the current and recent state of the atmosphere, but they look for similar patterns in the weather that have happened before, with some physics. It then uses what happened in the past as a basis for what will happen in the future.
The European computer models, Google, etc., have all created deterministic models, which give the highest likelihood scenario, as well as an ensemble forecast, which gives a range of reasonable scenarios.
However, this new announcement from the United States government puts an important twist on these, one that may well put the U.S. in first place for the best forecasts. The United States just launched a new weather forecasting system called the Hybrid Global Ensemble Forecast System, or HGEFS for short.
The coolest part is how it works. It mixes two different kinds of forecasts to make one super-strong one. It takes predictions for a new AI ensemble model (AIGEFS), and combines them with predictions from the older, traditional physics-based model (AIGFS). Together, they aggregate a huge, 62-simulation “super team” of forecasts.
According to NOAA, this new HGEFS beats both the traditional system (called GEFS), and the pure AI system (AIGEFS) in almost every important test of accuracy.
“As far as we know, NOAA is the first weather organization in the world to run a system like this that blends regular, physics-based forecasts with AI ones,” according to NOAA.
Free computer weather model websites like TropicalTidbits.com or PivotalWeather.com (which you see in my weather videos) have these on their websites, free to view.
Now, to be fair, artificial intelligence has always existed in computer weather models, just a more primitive form.

Those physics-based models, like the GFS, used machine learning – a form of AI – to support the physics equations on the supercomputers. The AIGFS, and the other NOAA models, launched the use of “deep learning” to lead the way.
Secondly, the AI models – not just with NOAA, but with the Europeans – have less resolution than their physics-based counterparts. For example, the physics-based GFS starts with finer detail (about 13 km early on), which helps with local features like storms.
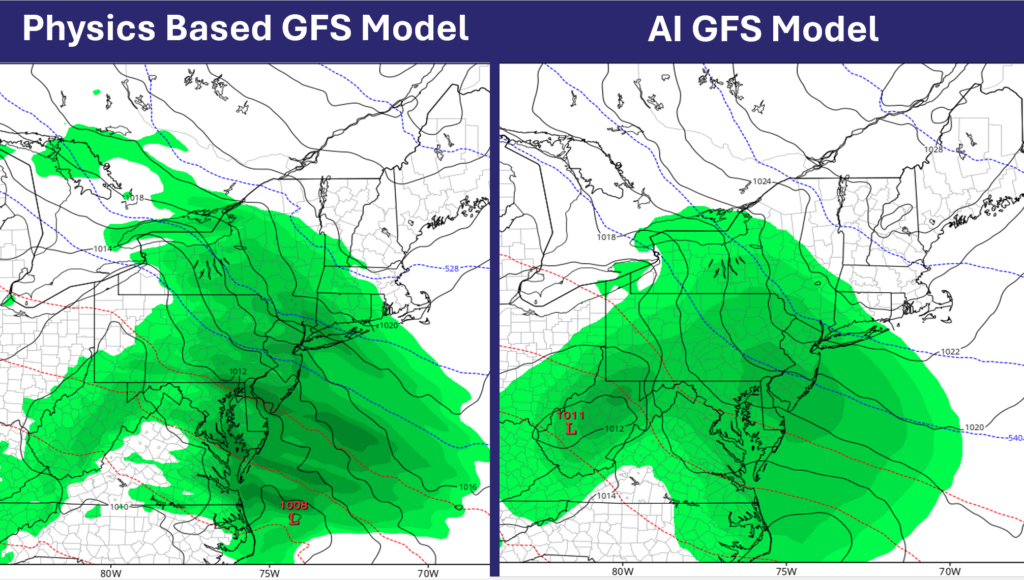
The AI version of the American GFS computer model has benefits, but still forecasts for the globe at a lower resolution than the physics based GFS computer model (via TropicalTidbits.com) The AIGFS sticks to 28 km globally, coarser than GFS’s best. The AIGFS only forecasts out in six-hour intervals whereas the GFS does so at three-hour intervals for the first 10 days.
Still, when matching up the new wave of AI models to the old ones, there’s a lot of promise to make your Jersey Shore forecast even more accurate.
For example, adding the new AI-based forecast to the mix lets us make reliable predictions a full day further into the future than we could with the traditional physics-based models alone.
For meteorologists and weather weenies alike, these AI models will come out more often. The physics-based GFS runs four times a day. This can run more than 24 times a day, giving us that critical data more quickly.
Finally, these forecasts mean little if they’re not in the hands of a degreed meteorologist. This AI computer model news from NOAA gives us an ever sharper, easy-to-access tool in our toolbox. However, we are the ones who fit the data into your local forecast and communicate clearly to you what it means.
Those with the American Meteorological Society’s Certified Broadcast and Certified Digital Meteorologists do so at the highest level.
Joe Martucci, a Certified Broadcast Meteorologist and Digital Meteorologist, is the President and Director of Meteorology for Cup A Joe Weather and Drone. You can connect with him at cupajoe.sparkable.opalstacked.com/.