Category: Shore Local Magazine

  • NJ Nor’easter brings top 10 highest tide, record rain, erosion

    NJ Nor’easter brings top 10 highest tide, record rain, erosion

    This article initially appeared in Shore Local magazine on Oct. 16

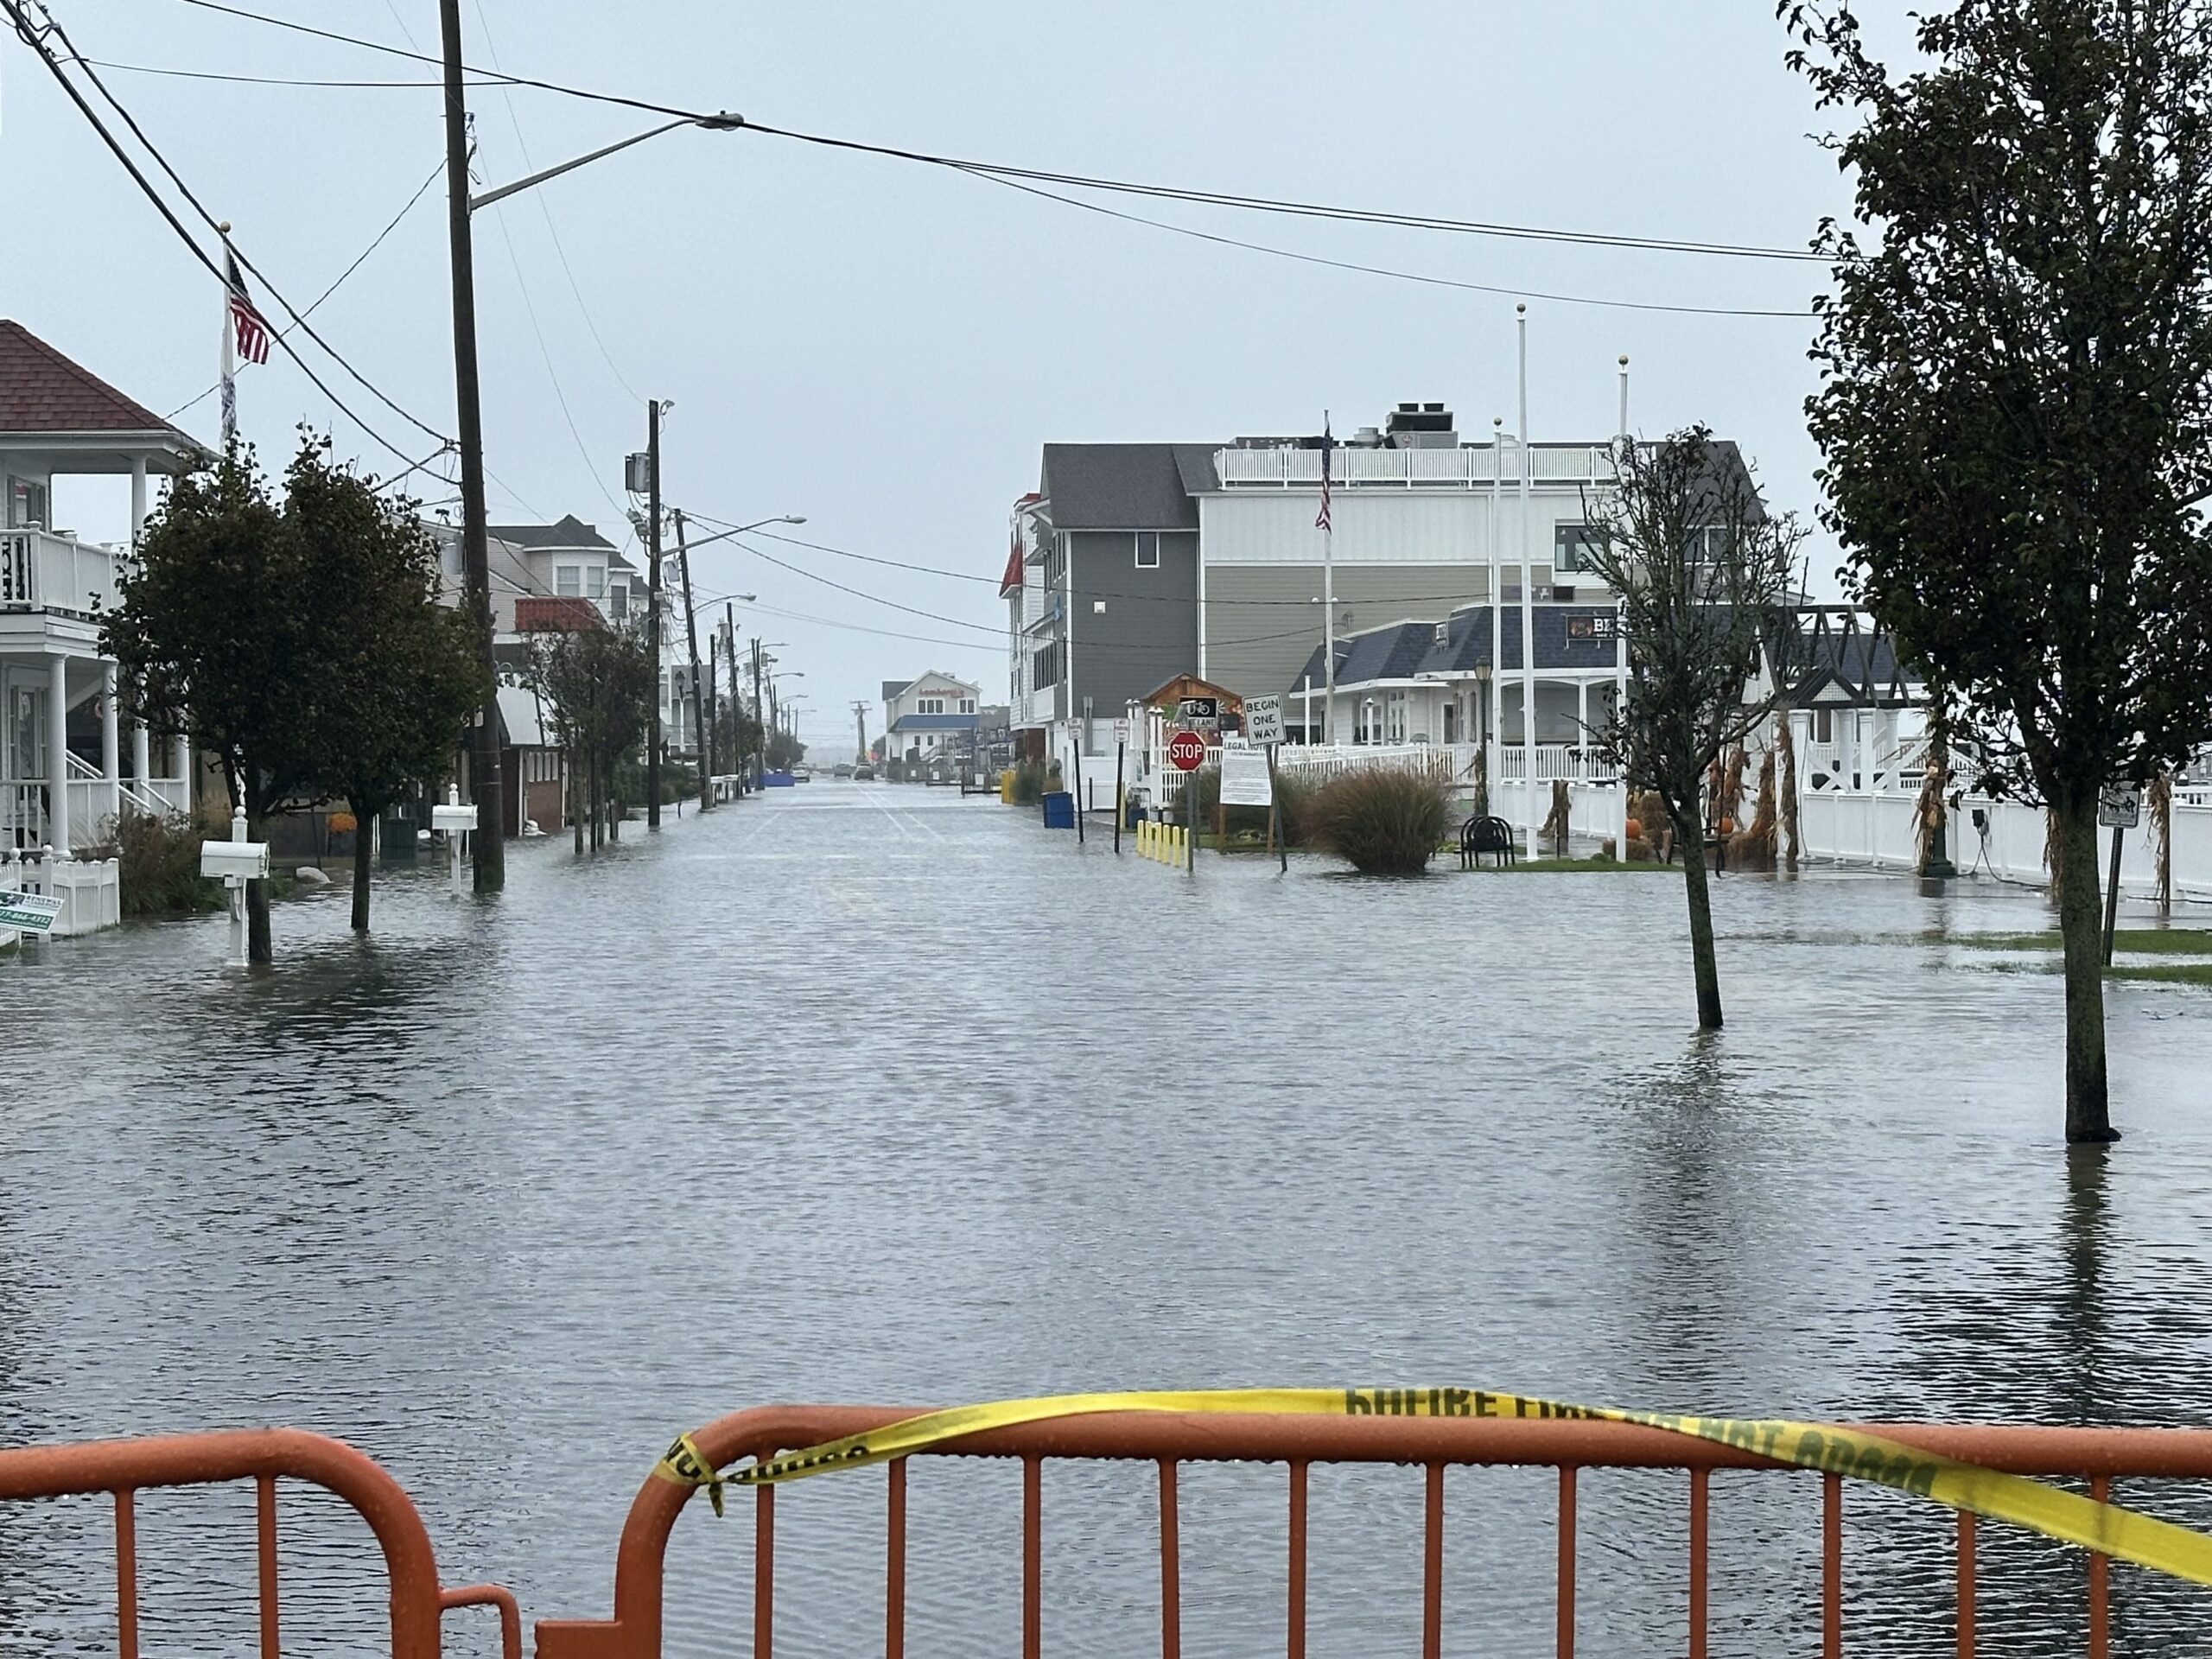
    It ripped, roared and, most consequentially, flooded. The first nor’easter of the 2025-2026 cool-weather season may very well turn out to be the most powerful one. Here are the most impressive storm stats to me for the Jersey Shore and beyond.

    – The Sunday or Monday afternoon high tide was in the top 10 highest on record for nearly everywhere, from Cape May up to southern Monmouth County, according to the National Oceanic and Atmospheric Administration.

    – Most of Cape May and Atlantic counties saw three consecutive tides in moderate flood stage.

    – Sen. Frank S. Farley State Marina broke a daily rainfall record that had stood since 1927.

    Plus, while we will remember this as a nor’easter, there were tropical characteristics to this storm, too. Let’s explain the details for all of this.

    How severe were the tides at the Jersey Shore?

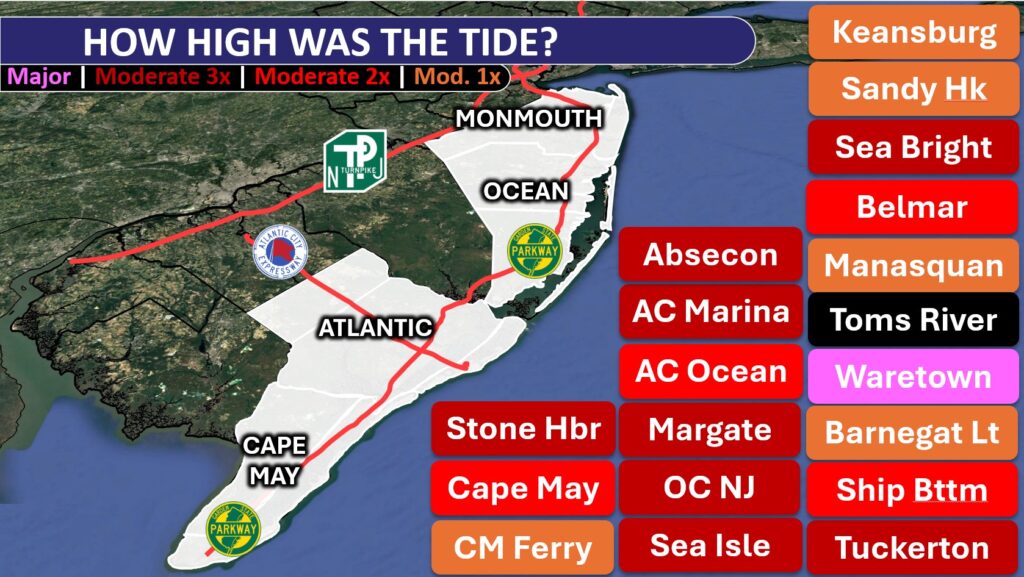
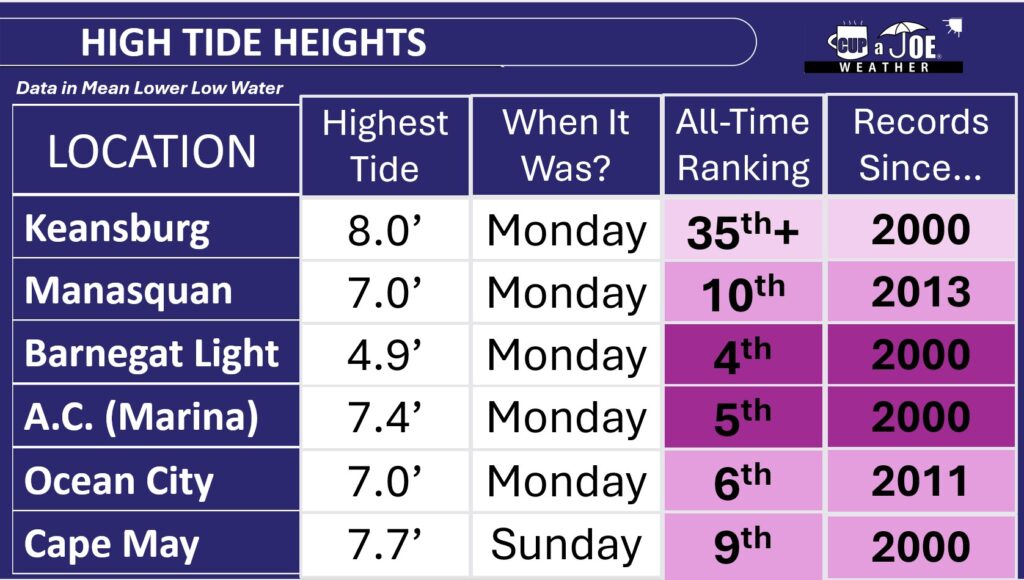
    Atlantic City Marina had its fifth highest tide on record, peaking at 7.4 feet above mean lower low water, the average height of the two lowest low tides Monday afternoon.

    Ocean City had its sixth highest tide on record, reaching 7.0 feet above mean lower low water Monday.

    Down near Exit 0 in Cape May, the ninth highest tide on record, peaking at 7.7 feet above mean lower low water, was experienced on Sunday.

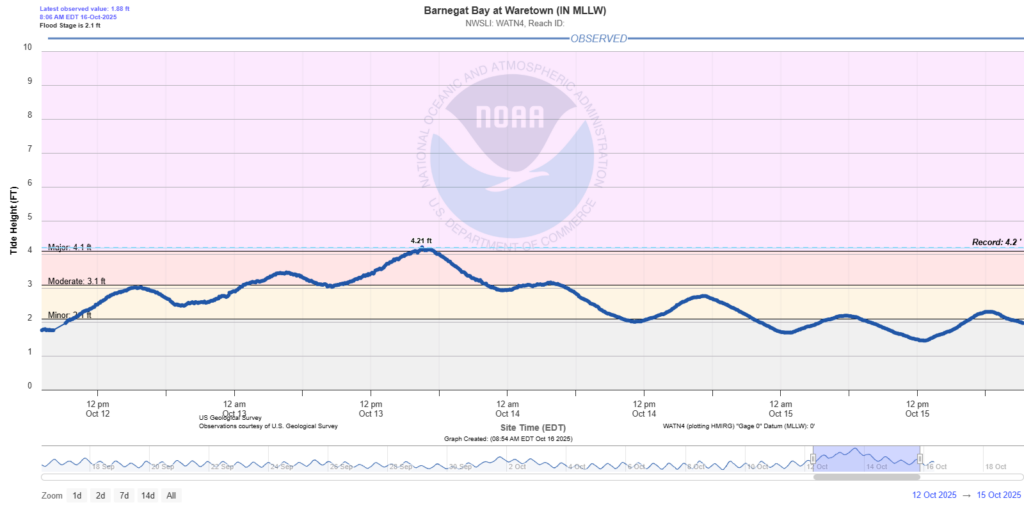
    Ocean County ended up having the highest tides. Barnegat Light in the northern part of Long Beach Island, had the fourth highest tide on record. Meanwhile, across the Barnegat Bay in Waretown, 3 feet of water was recorded in the lowest-lying areas — their worst recorded tide.

    Tide heights in Waretown, Ocean County, on the Barnegat Bay from Oct. 12 to Oct. 15. The 4.21 foot above mean lower low water is the highest in its recorded history (data via the National Oceanic and Atmospheric Administration).

    Farther north Manasquan, Monmouth County, had its 10th highest tide. The least severe flooding was on the Raritan Bayshore. They stayed in minor flood stage.

    There is a caveat to all of this. These records only go back to 2000 at the earliest. So it doesn’t count the 1991 or 1992 nor’easters, the 1962 Ash Wednesday storm or the 1944 hurricane, among others. However, there have been roughly 9,100 days between 2000 and fall 2025. This tide ranks in the top 0.1%. That’s impressive.

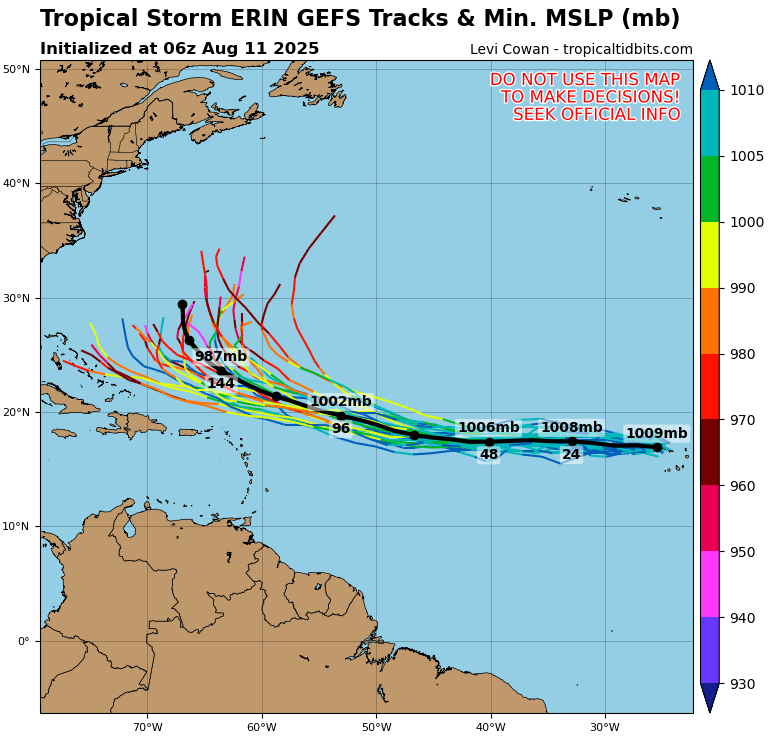
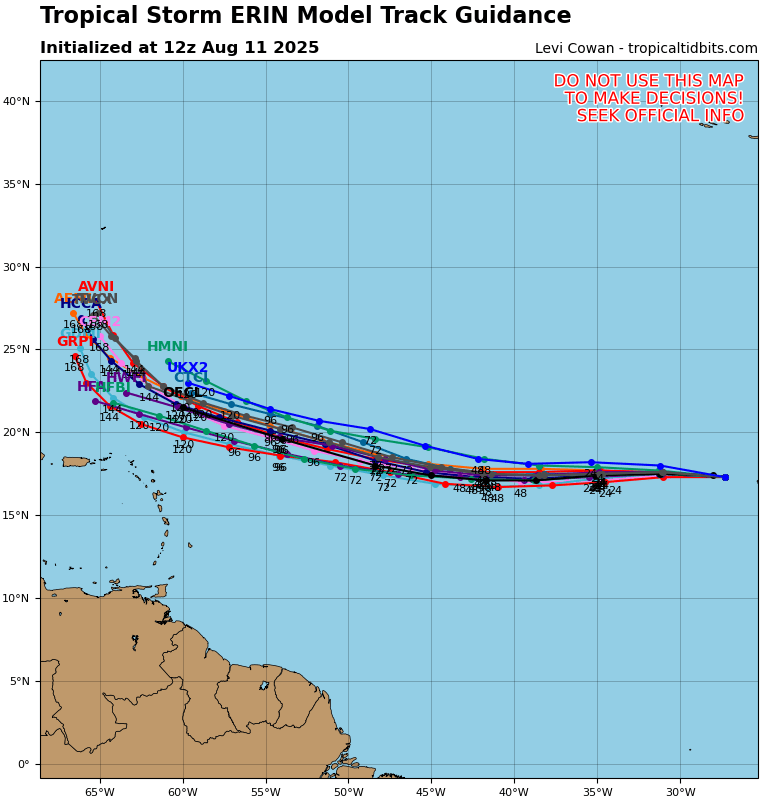
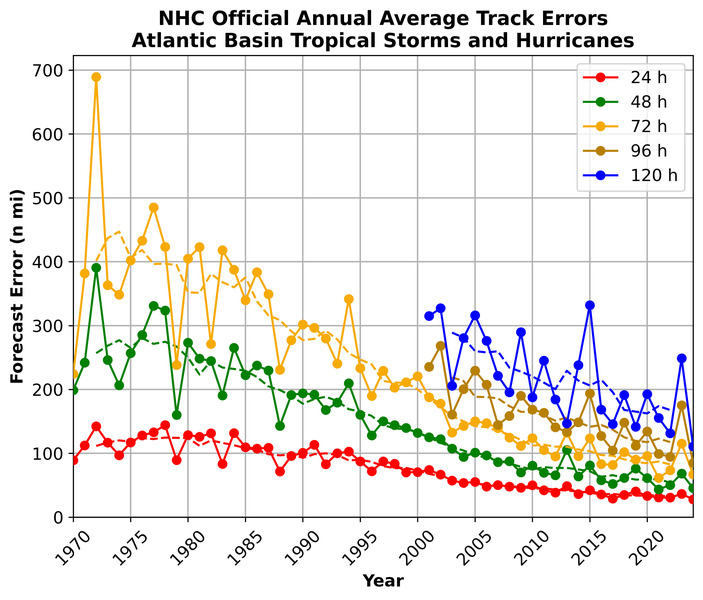
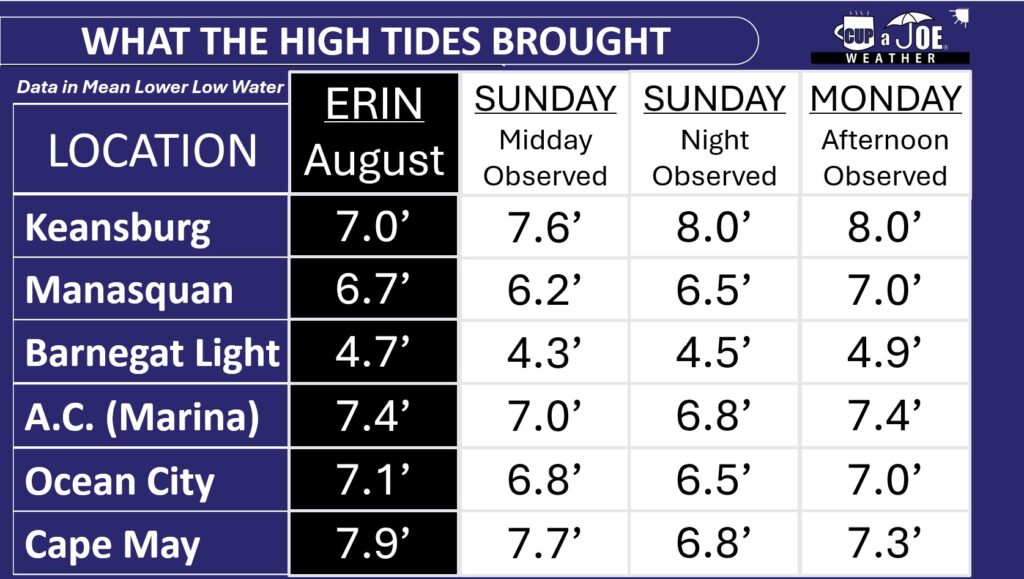
    To put things in perspective, it helps to have a recent event with which to compare the storm, so let’s consider Hurricane Erin.

    In late August, Erin brought the highest storm surge on record to the following locations: Absecon, Atlantic City (Inside Thorofare), Sea Isle City, Avalon, Stone Harbor and Cape May (bayside), according to NOAA.

    For the South Jersey shore, south of Long Beach Island, the highest tide stayed near Erin’s height, whether it happened on Sunday or Monday afternoon. North of LBI, at least one of the two tides from the nor’easter were higher than Erin.

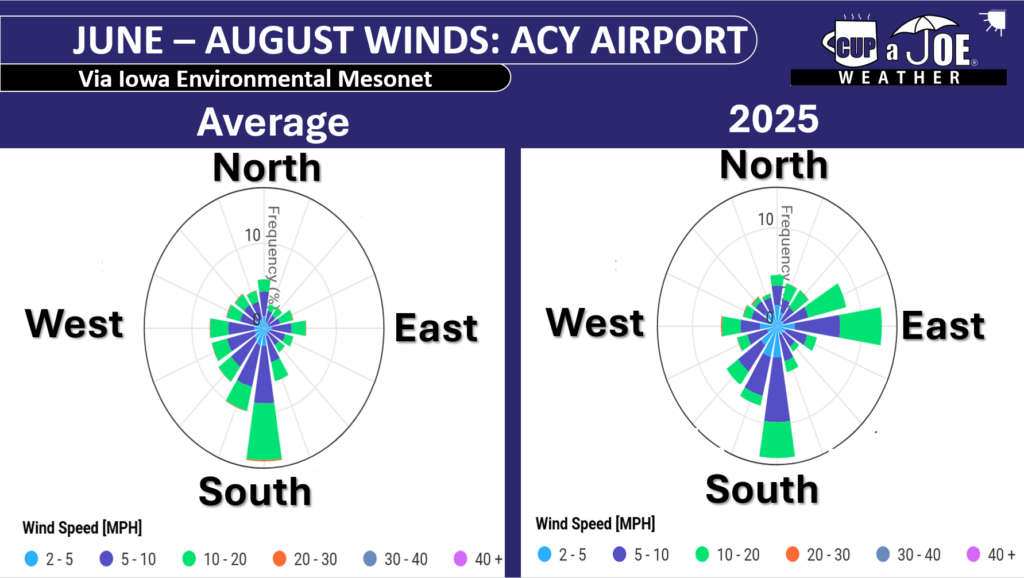
    The South Jersey shore could have been worse. Thankfully, winds on Monday morning were from the northwest — offshore — which pushed some of the water out. Had they been northeast, like the rest of the Jersey Shore was, towns like Ocean City and Somers Point would have had tides higher than Erin on Monday afternoon, pushing into major flood territory.

    How much beach erosion occurred at the Jersey Shore?

    The exact details won’t be known until towns and the Army Corps of Engineers complete their post-storm surveys. However, expect to hear that issues are widespread and severe for a few.

    Towns already have stark cliffs of sand on the beach from Erin in August. Tack on additional erosion from a storm in September, and our sand infrastructure was already worse than it would be this time of the year going into the Oct. 12-13 storm.

    I imagine every beach town has more erosion than they’d like to stomach for it being so early in the erosion season. Hopefully, this winter and next spring will have fewer nor’easters than usual.

    Gusts over 60 mph

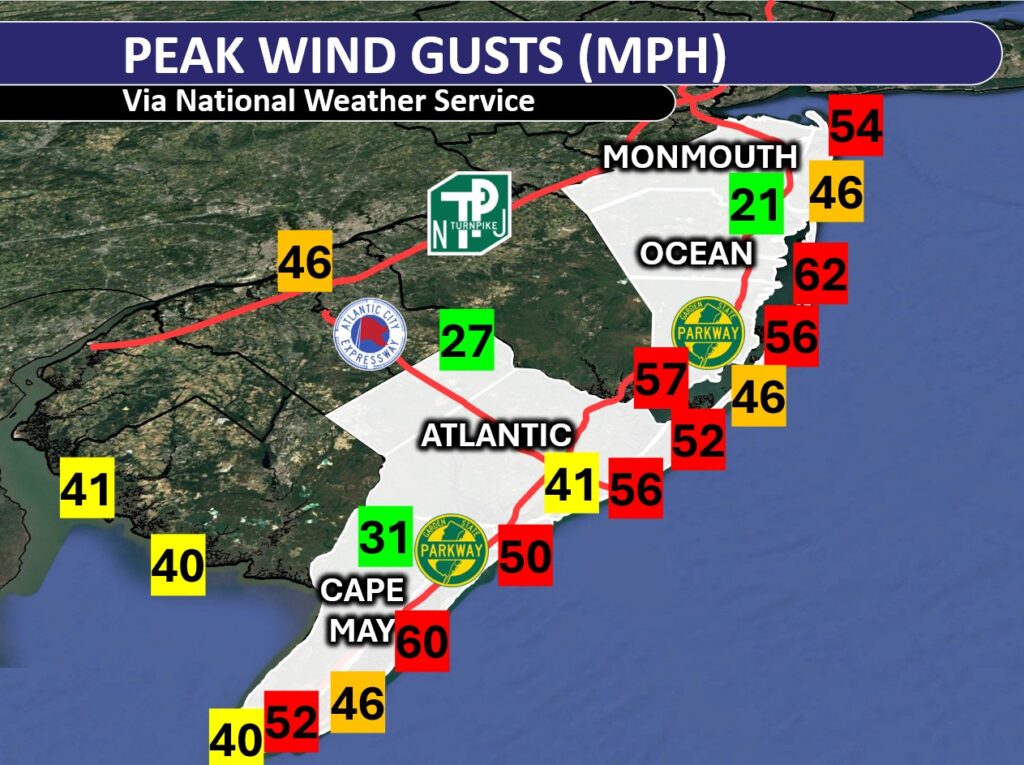
    Wind gusts over 45 mph were widespread east of the Garden State Parkway, and on the bayshores. Island Beach State Park in Ocean County had the highest reported wind gusts, with 62 mph recorded at an Office of the New Jersey State Climatologist weather station. However, Avalon in Cape May County and Surf City in Ocean County also touched 60 mph.

    Here are some other top gusts:

    Atlantic City – 56 mph

    Brigantine – 52 mph

    Cape May Harbor – 52 mph

    Ocean City – 50 mph

    The sustained winds, or constantly blowing ones, made for whistling trees and rattling outdoor furniture Sunday and Monday. Generally, it was 20 to 30 mph at the shore.

    Gusts were much weaker inland. Woodbine in Cape May County reached 31 mph, and Hammonton in Atlantic County only got up to 27 mph.

    Rain was heavy, too

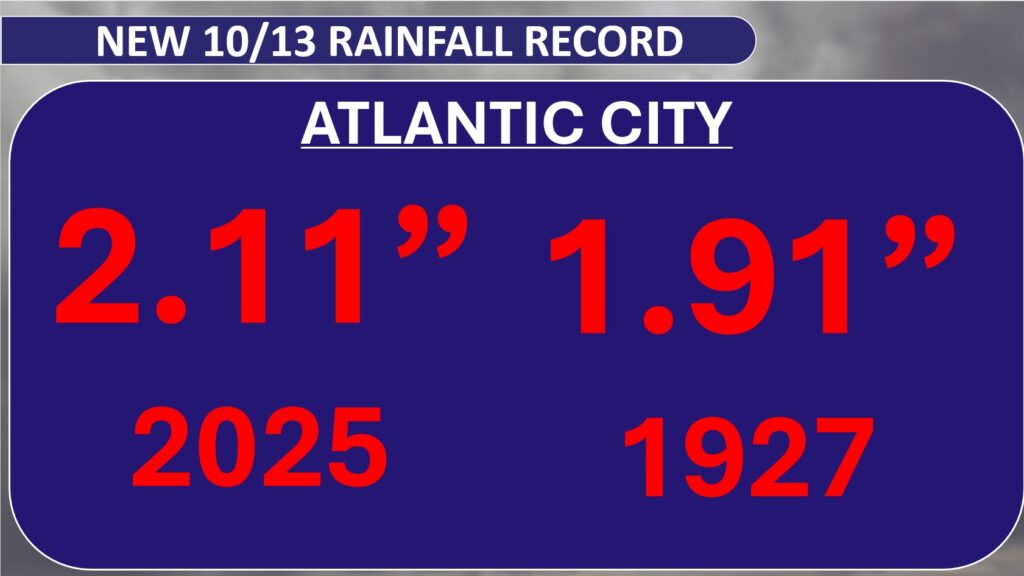
    Rain was the least of our concerns with this storm, but we still had a soaking; that is, east of the Garden State Parkway. Atlantic City Marina broke an Oct. 13 daily rainfall record with 2.11 inches of rain, beating the previous record set back in 1927, according to the NOAA.

    Generally, rainfall totals were between 2 and 3 inches in Atlantic County. Cape May County generally had 1 to 2 inches of rain.

    Once you got away from the four coastal counties — Cape May, Atlantic, Ocean and Monmouth — rainfall measured only up to an inch. Out near Trenton and Philadelphia, it was less than a half inch.

    Jersey Shore streaming weather channel

    I am targeting a launch date between Oct. 18 to 21 for the Jersey Shore’s streaming weather channel. Thanks to Sparkable (who also run the Shore Local website), everything Jersey Shore weather, with a little drone, will be on my YouTube channel and website for your viewing pleasure.

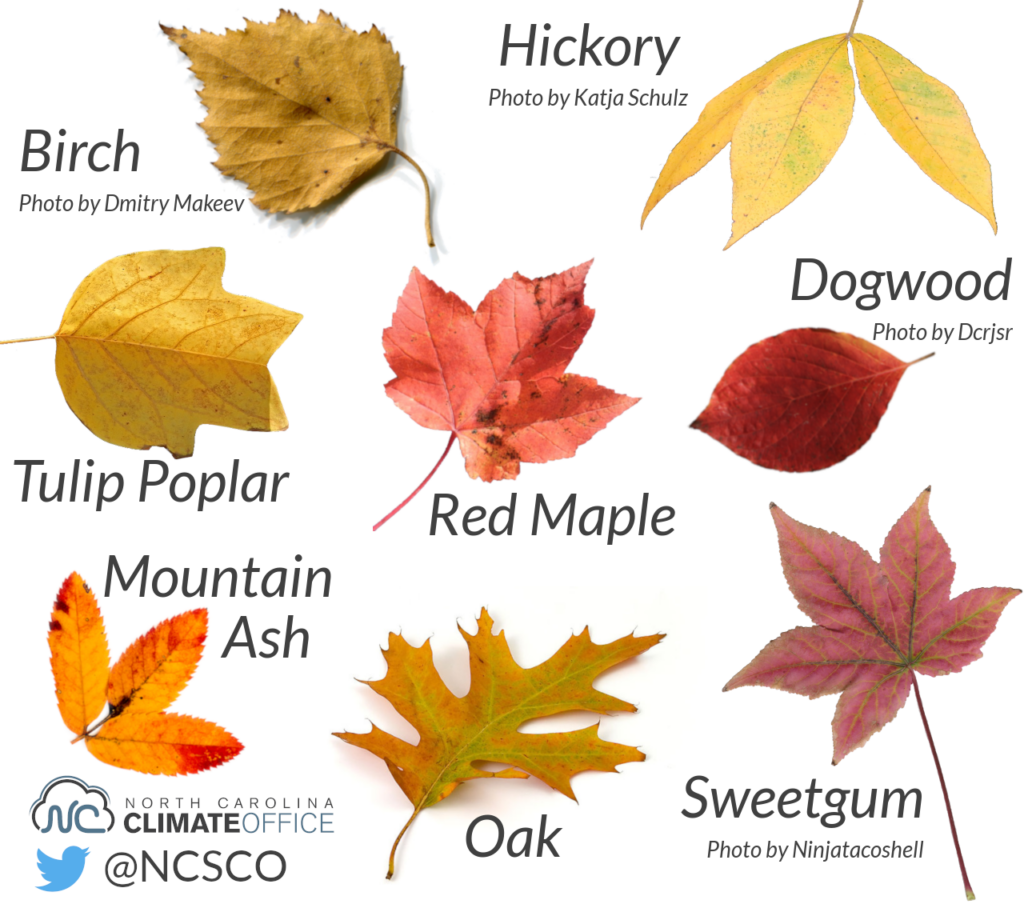
    Tide and marine forecasts, current conditions, forecast videos, radar and support from our sponsors will all be on there. I also want to see your Jersey Shore photos! Submit your sunrises, snow, thunderstorms and fall foliage to be featured in a special shot on the livestream.

    Keep it on your smart TV or computer all day long. Stay tuned for more details.

  • 2025’s Ocean was so Warm in NJ, It Almost Broke a Record

    2025’s Ocean was so Warm in NJ, It Almost Broke a Record

    The summer tide came rolling in this year much warmer than 2024. In fact, the water we enjoyed was tropical enough to be one of the warmest on record at the Jersey Shore.

    From June to September, peak beach season, the ocean water temperature from the gauge at Atlantic City’s Steel Pier averaged 71.4 degrees. That is tied with 1951 for the fifth warmest season since records began in 1912.

    This was exactly five degrees warmer than last year, at 66.4 degrees. Remember last year? The water was cold. You sweated on the sand but shivered in the ocean.

    June and July had zero days with a water temperature above 75 degrees last year in Atlantic City. In fact, 11 July days were in the very chilly 50s, and 55 degrees was the 8 a.m. water temperature on July 18, 2024.

    The old saying, “life’s at ease with an ocean breeze” is true. Wind direction all summer, and Locals’ Summer September long, play the critical role to this top five ranking.

    There are three main factors that drive water temperatures.

    The Sun: In spring and summer, the sun is higher in the sky, so it warms up the ocean water faster. In fall and winter, the sun is lower, so the water stays cooler.

    The Currents: In New Jersey, there is a warm ocean current called the Gulf Stream. It starts near Florida and flows all the way to Europe. It does not always reach New Jersey, but sometimes its swirls, bringing warmer water to the shore.

    Wind Direction: Winds that blow from the east, called onshore winds, push warmer ocean water toward the beach. But winds from the south or southwest bring colder water. When winds blow along the shore, they can cause something called Ekman Pumping. This pushes warm surface water away and pulls up colder water from the bottom of the ocean, where we swim.

    While the sun and currents are constant, the wind direction varies day by day, month to month and, for purposes of this article, year by year. This is why it was warmer.

    Onshore winds blew 30% of the time between June and August at Atlantic City International Airport in Egg Harbor Township this year, our closest NOAA weather station with wind direction to Atlantic City.

    The average is 15%. In other words, we had double the number of onshore winds as usual.

    September was the same, with onshore winds roughly 38% of the time in 2025. 27% is the average.

    Those extra onshore winds pushed in some warmer water from the Gulf Stream and limited the amount of colder upwelling. It also led to an August that was cooler than average on land and just about average during September, according to New Jersey State Climatologist Dave Robinson, my other weather dad. Insert YouTube video here.

    The average June to September water temperature is 68.6 degrees. June was the only one below average, at 65.8 degrees. That is not a surprise. However, July (72.9), August (74.8), September (72.1) were all above average.

    If you had to compare it, the sea surface temperatures you experienced this season were more like an average season for Virginia Beach.

    August 16 and 17 were the warmest water days, staying above 80 degrees. June 1 itself had the coldest water, staying below 60 degrees. No surprise there, as the sun is trying to heat up the water.

    We are Going Live!

    Also, I am extremely excited to say that the Jersey Shore’s first 24×7 livestreaming weather channel is going live soon! Thanks to Sparkable (who also runs the Shore Local Website), everything Jersey Shore weather, with a little drone, will be on my YouTube channel and website for your viewing pleasure.

    Tide and marine forecasts, current conditions, forecast videos, radar, and support from our sponsors will all be on there. I also want to see your Jersey Shore photos! Submit your sunrises, snow, thunderstorms and fall foliage to be featured in a special shot on the livestream.

    Keep it on your smart TV or computer all day long. Stay tuned for more details.

  • The Fujiwhara Effect: When 2 tropical cyclones collide

    The Fujiwhara Effect: When 2 tropical cyclones collide

    This article initially appeared in Shore Local News on 10/2/2025. The article was update to include more current information from Imelda and Humberto on 10/2/2025

    Last week, I mentioned on my digital and social weather channels that Hurricanes Humberto and Imelda could undergo a rare interaction called the Fujiwhara Effect.

    Humberto and Imelda partially made this happen, but not completely. Either way, it doesn’t matter for our Jersey Shore weather forecast. A powerful arctic, high-pressure system kept the rain away from these two storms. However, there were gusts to 40 mph and coastal flooding on Oct. 1 and bad surf continues into the weekend.

    The Fujiwhara Effect, like polar vortex, heat dome and derecho before it, brings a new weather word into public discourse. And for your Shore Local meteorologist, it means I get pumped to explain a new-to-many weather phenomenon.

    What is the Fujiwhara Effect?

    “The tendency of two nearby tropical cyclones to rotate cyclonically about each other as a result of their circulations’ mutual advection,” The American Meteorological Society’s Glossary of Meteorology says. However, let us break that down even more.

    Think of the Fujiwhara Effect as a square dance. Instead of pairs of dancers, they are pairs of tropical storms or hurricanes.

    In square dancing, pairs of dancers spin and move in patterns together. The same is true with the Fujiwhara Effect. Instead of a caller’s instructions, though, storms follow nature’s rules.

    Technically, the Fujiwhara Effect happens when storms are within 900 miles of each other’s circulation. That is the distance from Ocean City, N.J., to Tampa, Fla. That is not much in the vast expanse of the Atlantic Ocean.

    The two storms’ counterclockwise (Northern Hemisphere) or clockwise (Southern Hemisphere) winds will start to spin closer to each other. Once they are about 200 miles apart, one of three scenarios happens:

    1.           The larger storm will absorb the smaller storm into its circulation.

    2.           The two storms will merge, creating one more powerful storm.

    3.           Both storms will weaken due to the increase in wind shear or change of wind direction with height.

    The Fujiwhara Effect is named after Sakuhei Fujiwhara, a Japanese meteorologist who first described this phenomenon as a theory in a 1921 research paper. Turns out his theory was correct.

    Where does the Fujiwhara Effect occur most often?

    The northern Pacific Ocean is the place where it happens the most, the American Meteorological Society reports.

    The Pacific Ocean, specifically the western Pacific Ocean, is the world’s most active tropical cyclone basin, thanks to its very warm water and humidity. Plus, since the Pacific Ocean is the world’s largest ocean, more storms can simply spin around there, and potentially come into contact with each other.

    It is rare to have the Fujiwhara Effect in the Atlantic Hurricane Basin. Records are not kept on them, but they happen only once every couple of years. Compared to the Pacific Ocean, there is less area for tropical storms or hurricanes to develop.

    Also, our ocean has just one main storm track: Off the West Coast of Africa to the Caribbean Islands, turn north between the United States East Coast and Bermuda, and then northeast into the northern Atlantic Ocean. This gives less opportunity for storms to cross paths.

    Notable Fujiwhara Effect storms

    The Fujiwhara Effect likely took place in the Atlantic Hurricane Basin in 2016 when Hurricane Matthew and Tropical Storm Nicole interacted. They did not fully dance with each other, however, Matthew’s path shifted a bit, which brought major flooding to the East Coast of Florida.

    The last time on record that Atlantic storms underwent a full Fujiwhara Effect was in 1995 with Hurricanes Iris and, fittingly for this article, Humberto. On Aug. 23, 1995, Hurricane Iris was on a northern path from the Lesser Antilles in the tropical Atlantic Ocean. Then it interacted with Humberto. The Fujiwhara Effect took place, jolting Iris 300 miles to the east.

    Both storms weakened with the Fujiwhara Effect. After the interaction, Iris was downgraded to a tropical storm, while Humberto was downgraded from a Category 2 to a Category 1 hurricane.

    In the eastern Pacific Ocean, closer to North America, Hurricanes Hilary and Irwin in July 2017 showed a good example of the Fujiwhara Effect when the two made a full pivot around each other as they moved north up the Mexican coastline.

    The storms did not merge. They ended up weakening, in part due to the Fujiwhara Effect, and in part due to moving over cooler water.

    Joe Martucci, a Certified Broadcast Meteorologist and Digital Meteorologist, is the President and Director of Meteorology for Cup A Joe Weather and Drone. You can connect with him at cupajoe.sparkable.opalstacked.com/.

  • Despite the quiet, there’s still plenty of 2025’s hurricane season to go

    Despite the quiet, there’s still plenty of 2025’s hurricane season to go

    This article initially appeared in Shore Local Magazine on 9/25
    Thankfully, hurricane season has remained quiet. No major storms have made landfall in the United States, or really anywhere. By the numbers, this is a quieter-than-average year so far. However, don’t be lulled into complacency.

    By late September, the Atlantic Hurricane Season typically reaches its 10th or 11th named storm on average. That would be the “J” or “K” named storm. That’s “Jerry” or “Karen” according to the World Meteorological Organization, which is the group that determines storm names.

    Through Sept. 26 we’re only on Humberto, the eighth storm. She is expected to spin east of Bermuda, well away from the East Coast. New Jersey has seen elevated surf and a risk for rip currents. However, there are no direct impacts.

    Average progress of the Atlantic Hurricane Season from 1991-2020. Image via the National Hurricane Center.

    By the Sept. 27-28 weekend, Imelda. That would take us to the ninth named storm. That’s closer to average, but still on the quiet side.

    Now is not the time to be lulled into a sense of security, though. The forecasts for a more-active-than-usual season still have time to come true.

    Sixty percent of tropical activity occurs after Sept. 10 in the Atlantic Ocean, according to the National Hurricane Center, a government agency in Miami, Fla. But it came and went with a whimper. This has been one of only a handful of years when there were no active storms in the Atlantic Hurricane Basin during the season’s peak.

    By late September there is still plenty of hurricane season to go. Sandy, you will recall, made landfall near Brigantine on Oct. 29, 2012. The hurricane season officially runs from June 1 to Nov. 30, so it’s a backloaded season.

    Here’s a look at the latest hurricane forecasts from agencies I highly respect. These forecasts include what has already happened. Through Sept. 22 there have been seven named storms, two hurricanes and one major hurricane – Category 3, 4 or 5 storm.

    National Hurricane Center (from Aug. 7):

    • 13 to 18 named storms
    • 5 to 9 hurricanes
    • 2 to 5 major hurricanes

    Colorado State University (from Aug. 6):

    • 16 named storms
    • 8 hurricanes
    • 3 major hurricanes

    United Kingdom Met Office (from Aug. 1):

    • 16 named storms
    • 6 hurricanes
    • 4 major became

    There’s also something called Accumulated Cyclone Energy (ACE). I like to use this, and you’ll see people using this more often in the future. ACE measures hurricane season energy by adding up storm strength and duration score as it’s going on.

    Colorado State University, as well as the United Kingdom Met Office, issues forecasts for ACE. Both predict a 140-146 ACE index.

    This is all at or just above average. These forecasts still predict that all the activity we’ve had since hurricane season started will be duplicated between now and when the season ends two months from now; other words, just as hurricane season usually goes.

    Have your evacuation plan and get your go bag ready in case you need to leave. In the best case scenario, it will collect dust and stay dry during a quiet New Jersey hurricane season.

    Joe Martucci, a Certified Broadcast Meteorologist and Digital Meteorologist, is the President and Director of Meteorology for Cup A Joe Weather and Drone. You can connect with him at cupajoe.sparkable.opalstacked.com/.

  • “Average” Fall Foliage expected at the NJ Shore in 2025

    “Average” Fall Foliage expected at the NJ Shore in 2025

    This article initially appeared in Shore Local Newsmagazine on 9/18/2025.

    It will be an “average” year for fall foliage colors this season, the New Jersey Forest Service says. The combination of a wet, late spring; a dry August and September, and cool nights is the key to the 2025 forecast.

    Mike Zsoldos, assistant regional forester for the New Jersey Forest Service, met with me at Double Trouble State Park, located in Bayville, Ocean County, for an interview and drone footage.

    Double Trouble State Park (front), with the Barnegat Bay, the Barnegat Peninsula and the Atlantic Ocean in the distance (Photo by Joe Martucci)

    The park is right off of Garden State Parkway Exit 77. It’s a scenic Pinelands forest known for its Atlantic white cedar trees. Zsoldos said several of the already dwindling trees were destroyed in Superstorm Sandy. However, due to the Atlantic White Cedar Restoration Project, the trees are coming back, helping to offset ground and water pollution.

    2021’s Fall Foliage at Double Trouble State Park (New Jersey Division of Parks and Forestry)

    How Double Trouble got its name is up for debate, but the leading theory is that the dam at the village had to be repaired twice in one week due to muskrats. When a townsperson said “here’s more trouble” to a local minister, the minister replied, “yes, double trouble.”

    What ingredients are needed for perfect fall foliage?

    From the time the first green leaves sprout on the branches, to when the last crinkly brown leaf falls to the ground, there are four distinct ingredients that will create the perfect fall foliage season.

    1. From April to June, you want wetter-than-average weather. This gives the trees plenty of nutrients for growing foliage.

    2. Then, during climatological summer, from June to August, you’re looking for no extremes – no extreme heat and no extreme cooldowns, either. If there are, the trees get stressed.

    3. From the beginning of locals summer in September, to the time of peak leaf change, you’re looking for sunny days and cool nights to allow those vibrant fall hues to develop.

    4. Once we reach peak foliage, you’re simply looking for no heavy precipitation or wind. This way, the leaves won’t get blown off the trees early. That gives you plenty of time to enjoy them.

    When does fall foliage typically peak in NJ?

    For most of inland New Jersey, the average peak of fall foliage season is the third to fourth week in October, according to the meteorologist-led ExploreFall.com. At the Jersey Shore, as well as lower Cape May County, it’s early November.

    ExploreFall’s map archive shows that fall foliage tended to peak later in the 2010s than it did in the 1990s. However, New Jersey has returned to more typical timing in the 2020s, aside from last year, which was later than usual.

    How was 2024’s fall foliage in NJ?

    Zsoldos at the Forest Service said last year’s fall foliage was later than average. However, ExploreFall.com shows that it was within seasonable levels. The fall foliage season wound up being dull and quick to change. That was after a very promising April-to-August period, weather wise. Then the longest rain-free streak on record, and most significant drought in years put an end to the vibrant fall potential.

    ‘Average’ fall foliage season expected in NJ this year

    On the vibrant side, there was plentiful rain during the spring to bring the trees the nutrients they need. According to the Office of the New Jersey State Climatologist, 13.17 inches of precipitation fell throughout New Jersey from April to June – climatological spring. The average is 11.75 inches. Moreover, the cooler-than-average weather, which has controlled New Jersey since the beginning of August, produced many cool nights.

    “It’s going to help spark those indicators in trees to tell them it’s time to stop growing and start growing their sugars in the roots for winter (sugars help produce the vibrant colors),” Zsoldos said.

    From July 1 to Sept. 12, Atlantic City International Airport had 24 days with a low temperature at or below 60 degrees, according to the Iowa Environmental Mesonet. That’s more than the average of 16 days. Near Double Trouble State Park at Lakehurst Naval Air Station, there have been 30 such days – the most on record.

    On the other hand, New Jersey still hasn’t fully recovered from the drought which ran from last fall to early this year – the most significant on record. That put stress on the trees early in the growing season. There was also a stretch of extreme heat from June 23 to 25. Inland highs were in the 100s, with even the beaches getting well into the 90s.

    “I think this year, we’re looking at an average fall foliage,” Zsoldos said.

    During my visit with Zsoldos on Sept. 12, he noted the changes in the leaves already seen. He reminds us that fall foliage is a season and not a quick event. He usually sees the first orange and red hues on red maples in early August. You’ll still see a few, vibrant, straggling leaves during Thanksgiving, too.

    As the leaves turn vibrant, we’ll still need heavy rain and fierce winds to stay away from New Jersey to fully enjoy them. Medium-range forecast models lean toward drier weather for October and November. That means fewer opportunities for the rain and wind that would rip the leaves off the trees. It’s good news for leaf peepers.

    A widespread freeze also can quickly shut off the fall foliage process, turning green leaves to dull and brown colors quickly. While there’s always a risk of one night below 32 degrees between now and early November, when fall foliage usually peaks at the shore, there is no strong colder-than-average signal during this time.

    Where are the great spots to view fall foliage in NJ?

    “Average” is not a bad thing. An average fall foliage season will yield vibrant reds in the oak trees, yellows in the black maples and gold in the hickories across New Jersey, according to the United States Forest Service.

    Types of Fall Foliage, by tree species (North Carolina Climate Office)

    At Double Trouble State Forest, you’ll find excellent walking trails to take in the fall hues. Wharton State Forest is also an excellent spot, allowing visitors to go back in time to historic Batsto Village, and the wide trails and scenic views along the Mullica River.

    One of Double Trouble State Park’s many walking trails (New Jersey Division of Parks and Forestry)

    Birch Grove Park in Northfield is a personal favorite as well. It was home to my first Fall Foliage Forecast in 2017, and the walking trails built over the pond are an excellent way to spend the day.

    Joe Martucci, a Certified Broadcast Meteorologist and Digital Meteorologist, is the President and Director of Meteorology for Cup A Joe Weather and Drone. You can connect with him at cupajoe.sparkable.opalstacked.com/.

  • What history can tell us about NJ’s looming 2025-26 Winter

    What history can tell us about NJ’s looming 2025-26 Winter

    History shows that when July is hotter than usual and August is cooler than usual, like what just happened at the Jersey Shore this year, it’s a good clue about what the coming winter might be like. Here’s why past weather patterns suggest it could be colder than average.

    Using information from the Office of the New Jersey State Climatologist, where I did research during my senior year at Rutgers University, I collected average temperature data for every month since 1895. I focused on the Coastal Zone, which the climate office describes as areas east of the Garden State Parkway in Monmouth, Ocean and Atlantic counties, plus almost all of Cape May County.

    Via the Office of the New Jersey State Climatologist

    Snowfall data came from the National Oceanic and Atmospheric Administration for Lower Township, Atlantic City International Airport, Atlantic City and Long Branch. While Atlantic City doesn’t report snowfall anymore, they did from 1874 to the 1950s, which I used for this project.

    What do a hot July and a cooler August mean for the Jersey Shore’s winter temperatures?

    Going back to 1895, there have been 18 years when a cooler-than-average August followed a hotter-than-average July in the Coastal Zone. That includes 2025 when August wound up 3.2 degrees below average – 31st coolest of the 130 years of record keeping. July was 2.4 degrees above average – the sixth hottest on record. The most recent such period before that was 2017.

    Average here is defined as the period of record average from 1895 to 2025. Usually, though, meteorologists use a 30-year average to discuss what is above or below average. The period of record average is cooler than the most recent 30-year average due to the changing climate.

    I then investigated what temperatures were for December through March for the months following those July-August stretches. There was a strong signal for temperatures to be colder than our most recent 30-year average. The 17 years broke down like this for the four-month December-March period.

    Colder than average for all four months: 3
    Three months colder than average: 7
    Two months colder than average: 5
    One or no months colder than average: 2

    In other words, 59% of years had all months colder than the 1991-to-2020 average; 12% had no or only one month colder than average.

    If September is chilly, too, history says a frigid winter is likely.

    September is also likely to be cooler than the period of record average, given the first 10 days of the month, as well as the forecast through at least Sept. 18.

    The historical likelihood that winter will be colder than average, based on just those years, is even higher. Of the 12 times this happened, 10 had at least three months between December and March that were colder than average.

    The 17 years on record that had a hotter than average July and then a cooler than average August. The blue and yellow boxes indicate temperatures cooler than the 1991-2020 climate average for those months in row 1.

    Hot July, cool August: Snowy winter at the Jersey Shore?

    The history books don’t show a clear link between a super-hot July and a cooler-than-usual August when it comes to snowy winters. Here’s what we found about snow at four Jersey Shore weather stations after 17 winters with that kind of July and August:

    Lower Township: 6 winters had more snow, 7 had less.

    Atlantic City International Airport: 3 winters had more snow, 9 had less.

    Atlantic City: 3 winters had more snow, 4 had less.

    Long Branch: 6 winters had more snow, 4 had less.

    Each weather station has been around for different amounts of time, so the number of years checked isn’t the same for all. But if you love snow, you might be excited to know that the last two times this happened (the winters of 2017-’18 and 2013-’14), there was more snow than usual. Also, if September is cooler than normal, the chances of a snowy winter go up. Out of 12 years with a hot July, cool August, and cool September, most had more snow than average.

    Snowfall totals for four Jersey Shore locations in winters where the previous July was hotter than average and August cooler than average. The purples indicate a snowier than average winter. The grays indicate a less snowy than average winter.

    Does history matter when it comes to this winter’s forecast?

    Brigantine’s local roads remained icy two days after the first inch of snow in nearly two years fell on New Jersey in January 2024. (Photo by Joe Martucci)

    September is in the middle of the August-to-October time frame that long-range forecasters typically use to do their winter forecasts. As part of their research, they look at what the weather in previous springs and summers was like. They then look at what the following winter was like to give them an idea of what to expect. So if, for example, 2017 had conditions similar to 2025, they’d look at the winter of 2017-’18 to give New Jerseyans an idea of what this winter will be like.

    They’re called analog years in the weather world. While each forecaster has their own winter formula, analog years are a part of the process, but usually not the main source of information they use.

    I don’t do my own winter forecast. However, look for a winter forecast by the top Northeast experts in October. We can read whether they used the winter of 2017-’18 or 2013-’14 as an analog year.

    9/11 at the Jersey Shore

    Via the City of Absecon

    In this Shore Local Weather Column, published on Sept. 11, let’s reflect on the tragic events of Sept. 11, 2001. That day brought uncertainty, pain and incredible strength to our nation. As Alan Jackson’s song asks, “Where were you when the world stopped turning?”

    If you’re old enough to remember, take a moment to think back on where you were. You might also consider visiting one of the 9/11 memorials along the Jersey Shore. My favorite is in Absecon – it’s powerful, with a lifelike replica of the Twin Towers that’s both beautiful and deeply moving.

    Joe Martucci, a Certified Broadcast Meteorologist and Digital Meteorologist, is the President and Director of Meteorology for Cup A Joe Weather and Drone. You can connect with him at cupajoe.sparkable.opalstacked.com/.

  • How did NJ’s 2025 Shore Summer Weekend Weather Report Card grade?

    How did NJ’s 2025 Shore Summer Weekend Weather Report Card grade?

    This article initially appeared in Shore Local magazine on 9/4/2025

    The past 11 weekends at our beach towns graded a ‘B’ or above, but it still wasn’t enough as 2025 was the lowest performing summer in the eight years of my Shore Summer Weekend Weather Report Card.

    How the report card is graded

    Since 2018, we’ve graded the shore summer weekends from Memorial Day to Labor Day. That’s Friday to Sunday, but also Mondays for Memorial Day and Labor Day. Fourth of July is either included in the weekend or on its own. It was July 4-7 for the 2025 edition.

    I say we’ve graded because you shape the report card. You helped set the criteria for the perfect ‘A’ for your summer shore weekends.

    An ‘A’ requires temperatures between 75 and 85 degrees, no rain, winds between 5 and 15 mph, low humidity and sunny to partly sunny skies. This report card covers Cape May to Sandy Hook, so if it’s 90 degrees far south, but 85 degrees everywhere else, that won’t ruin a perfect ‘A’ grade.

    The 2025 report card for the Jersey Shore

    The final grade point average for the 15 summer weekends was a 2.9; good enough for a ‘B,’ but not good enough to get us out of eighth place of the eight summers I’ve graded. You have to look at the beginning of the summer to understand why.

    From Memorial Day weekend to June 13-15, the weekends earned a C+, D+, C+ and D+. It was rough; so rough, we did a Shore Local article about it.

    “The reason for these gloomy, cooler weekends is part bad weather luck, and part science,” I wrote on June 19.

    New Jersey sat in the middle between two air masses; the jet stream floated over the state. That brought the cool, stormy weather. Then, in a stroke of bad luck, the same pattern repeated itself every seven days, on the weekends.

    The warm, bright summer weather that most of us know and love doesn’t settle in until mid-June. Poor weather weekends early in the season are common. Still, 2025 was the worst start in our eight-year history of report cards up until then. After that, the Jersey Shore studied hard to bring up its grade, but 2025 never broke out of last place.

    The 11 weekends, from June 20 to Labor Day weekend, were all either a B, B+ or an A. If we just looked at those, the grade point average would be a 3.3; that’s a B+! This included a perfect ‘A’ for the Fourth of July weekend. I was away on vacation, but just talking with you and seeing the weather data, it’s fair to say it was the most comfortable Independence Day weekend in years.

    We also had another ‘A’ for Aug. 8-10. Like most of August, the humidity stayed low and the amount of sunlight stayed high.

    This past weekend, Labor Day, earned a B+. The only downside was it was a bit too cool, in the low 70s for highs most days. However, it was plenty sunny, not humid at all and had pleasant breezes. It’s a great sign of the Locals’ Summer September to come.

    This was the lowest grade in the history of the report card. However, the 2.9 is just half a point away from the highest grade earned in the summers of 2022 and 2019. In other words, the shore never has a poor summer, climatologically speaking.

    The eighth annual Shore Summer Weekend Weather Report Card

    Furthermore, there was plenty of good weekend weather after Father’s Day, when summer kicks into high gear here.

    Final grade point averages by year

    • 2025 – 2.9 (B)
    • 2024 – 3.3 (B+)
    • 2023 – 3.3 (B+)
    • 2022 – 3.4 (B+)
    • 2021 – 3.0 (B)
    • 2020 – 3.1 (B)
    • 2019 – 3.4 (B+)
    • 2018 – 3.1 (B)

    How will September’s weather be?

    Temperatures should wind up at or just below average for the month of September. I don’t see a big change on the horizon taking us out of the generally cooler and drier weather pattern we’ve been in since the beginning of August.

    The CFS forecast computer model for the month of September. The animation is for a week timeframe, seen on the upper left. The blues indicate cooler than average temperatures, which NJ is expected to see for most of September. (via TropicalTidibts.com)

    High pressure should generally center itself in Pennsylvania or West Virginia. That will bring us another drier-than-average month, unless a tropical system comes through.

    Then, since winds spin clockwise around high-pressure systems, our winds will generally be out of the northeast. That should keep ocean water temperatures in the 70s most of the month, but also keep our on-land high temperatures mostly in the 70s as well.

    So, it will be very comfortable with plenty of good days to spend by the water for Locals’ Summer September.

    We do need the rain, though. While not exactly known at the time of this writing, the beach towns should wind up with a top 10 driest August on record, according to NOAA’s Southeast Regional Climate Center. The mainland was still below average, just not as much. Farther away, Millville should be the driest August on record. Drought in New Jersey spread and worsened tremendously last September. Let’s hope that doesn’t happen again.

    Thanks for following the Shore Summer Weekend Weather Report Card. I hope you enjoyed seeing the grades as much as I like posting about them in my videos and on social media. Now, happy locals summer!

    Joe Martucci, a Certified Broadcast Meteorologist and Digital Meteorologist, is the President and Director of Meteorology for Cup A Joe Weather and Drone. You can connect with him at cupajoe.sparkable.opalstacked.com/.

  • What NJ can expect for the rest of the 2025 hurricane season

    What NJ can expect for the rest of the 2025 hurricane season

    Hurricane Erin glanced the Jersey Shore with an indirect blow, causing historic summertime flooding, dangerous surf and beach erosion. It marks the beginning of the peak of hurricane season, which promises to be active in the Atlantic Hurricane Basin.

    How will the rest of hurricane season be?

    It will probably be more active than usual, with a typical risk to the Jersey Shore.

    Colorado State University updated its forecast for August. For the hurricane season as a whole, from June to November, they project that 2025 will have 16 named storms. Of those, eight of them are expected to become hurricanes and three of them major hurricanes – Category 3, 4 or 5 storms.

    On average, there are 14 named storms – seven hurricanes and three major hurricanes each year. This year is a bit more active than usual. As of Aug. 23, we’ve already had some storms in the Atlantic, so the forecast predicts 11 more named storms – seven hurricanes and two major hurricanes to come. There’s still a lot of energy left in the hurricane season and we hope it doesn’t hit New Jersey.

    Colorado State University estimates the chances of a storm coming within 50 miles of New Jersey from Aug. 5 to Nov. 30 as follows:

    25% chance of a named storm

    8% chance of a hurricane

    1% chance of a major hurricane

    Probabilities of a named storm, hurricane or major hurricane being within 50 miles of each coastal state (via Colorado State University).

    All of that is about the average for the state. While Hurricane Erin impacted the shore, the storm’s center was 450 miles away from New Jersey at its closest, so that didn’t count. The peak of hurricane season is here.

    On average, the most active stretch of hurricane season is from mid-August to mid-October, peaking around Sept. 10, according to the National Hurricane Center in Miami, Fla. Not only are there the most storms during this time, but they’re typically the most intense. That’s due to the Atlantic Ocean, Caribbean Sea and Gulf of Mexico (Gulf of America) having their widest range of water temperatures: 80 degrees.

    Furthermore, Cabo Verde (or Cape Verde) storms are more likely during this time. Like Hurricane Erin, these are the far traveling storms that roll off the West Coast of Africa and travel across the ocean, giving it ample time to strengthen and organize.

    Key factors for the
    rest of hurricane season

    Colorado State University points to a few ingredients they’re paying attention to through November.

    The first one is sea surface temperatures. The central and eastern parts of the Atlantic Ocean were well above average in July. However, they’ve trended toward seasonable recently.

    The highest hurricane activity happens when the tropical Atlantic Ocean is more above average than the rest of the Atlantic Ocean. In other words, if the tropical Atlantic Ocean is 2 degrees above average, and the rest is 1 degree above average, that usually means more tropical cyclones. That’s not the case now given that Hurricane Erin cooled the water as it passed through the tropics, but this will be studied.

    Also, hurricanes can be affected by something called El Niño, La Niña, or neutral conditions (sometimes called “La Nada” for fun). This year, we’re close to neutral or La Niña, which means a slightly more active hurricane season.

    The last significant factor is the high amount of wind shear in the Caribbean Sea. Wind shear weakens hurricanes during hurricane season by disrupting their spinning structure, similar to how a strong gust might disrupt a spinning top, making it harder for the storm to stay strong or grow.

    If that remains, the hurricanes will be torn apart and weaken if they try to move from Africa into the Caribbean Sea and then northwest into Mexico, Cuba or the United States Gulf Coast.

    Wind shear in the Caribbean Sea doesn’t impact New Jersey much, though.

    Key messages for N.J.

    Hurricane Erin was a good reminder of what tropical systems can do to the coastline. Always listen to public safety officials during a weather emergency. They know how to keep you safe.

    If they tell you to leave your area, do it right away. Closing beaches and businesses to evacuate is important, and only happens when it’s really dangerous. They ask you to leave because staying could be very risky.

    Now is a good time to make your “Go Bag.” If you attended the Downbeach Community Meeting in Ventnor on Aug. 6, officials from Ventnor, Margate and Longport talked about this. Also, follow what we in the weather community are saying. Hurricanes.gov is the official resource for storm information.

    If you follow me on my website or social media that’s great and I love that. However, any degreed meteorologist is trained to deal with these situations.

    Look for those designated with a Certified Broadcast Meteorologist or Certified Digital Meteorologist seal from the American Meteorological Society for extra credibility.

  • Hurricane Erin brings worst summertime tide, on record, to the Jersey Shore

    Hurricane Erin brings worst summertime tide, on record, to the Jersey Shore

    If you’re a summer resident or visitor to the Jersey Shore, it’s possible you’ve never experienced tidal flooding like this in your lifetime.

    Margate was the most significant location for flooding on the entire shore. A transformer fire, electrical fire, six vehicle rescues, evacuations out of Sofia’s and Tomatoes, and a gas leak occurred, according to the Margate Fire Department. Water rescues occurred on the Black and White Horse pikes between Atlantic City and the Mainland.

    Looking at tide gauges for June, July and August, Hurricane Erin brought the highest storm surge on record to the following locations:

    Absecon, Atlantic City (Inside Thorofare), Sea Isle City, Avalon, Stone Harbor, Cape May (bayside) according to the National Oceanic and Atmospheric Administration.

    If you weren’t in these locations, then it was the highest summertime flooding since Tropical Storm Irene impacted north up the Jersey Shore in August 2011.

    The National Weather Service classifies flooding into three categories: minor, moderate and major. This was at the very high end of moderate.

    Moderate flood stage is when traveling around our coast is downright difficult. I was in Sea Bright, Monmouth County on Thursday night, reporting on the storm. Route 36, the main road in town, was washed out going south, causing us to exit the island north, near Sandy Hook instead. It was also bringing water into unraised homes and businesses.

    While moderate floods happen during the year, it’s almost always during nor’easter season, October to April, when fewer of us are at the shore. If you are here, it’s likely you’re not going out as much.

    Still, even this tide was unusually high, ranked among the top 10 highest tides of any month on record in Atlantic, Cape May and Cumberland counties.

  • 7 facts (and 1 opinion) about the National Hurricane Center forecast cone

    7 facts (and 1 opinion) about the National Hurricane Center forecast cone

    This article originally appeared in Shore Local Magazine on August 14, 2025

    The Atlantic hurricane season peaks from August to October.

    This is the time to have your “go-bag” ready in case you need to evacuate. It is also the time to check hurricanes.gov (National Hurricane Center) on a daily basis, I’ll pass along more information from them later in this column.

    Several major storms have fallen outside the hurricane season date range. Tropical Storm Fay hit New Jersey on July 10, 2020; Hurricane Isaias struck on Aug. 4, 2020, and Superstorm Sandy impacted the state on Oct. 29, 2012.

    Nonetheless, now is the time to be extra vigilant. It’s a good time to learn more about what the National Hurricane Center track forecast cone is, especially as Tropical Storm Erin is churning in the tropical Atlantic Ocean.

    Meteorologists shape the track forecast cone

    The National Hurricane Center building in Miami, Florida

    The National Hurricane Center (hurricanes.gov), a part of the National Oceanic and Atmospheric Administration (NOAA), is responsible for issuing all hurricane forecasts. Whether you follow me, another meteorologist in the news or elsewhere, that information all comes directly from the smart, hard-working folks at Florida International University in Miami.

    Formed in 1943, their vision is to be “America’s calm, clear, and trusted voice in the eye of the storm and, with its partners, enable communities to be safe from tropical weather threats.”

    Like most meteorologists, they use current observations and computer forecast model data to assist them in their forecasting.

    In the spring, our “Tidal Flooding Talk” team of Dan Skeldon (a recognized name in local meteorology) and I interviewed Mike Brennan, director of the National Hurricane Center. You can learn more about the NHC during our conversation on YouTube.

    The track forecast cone only predicts the path of the storm’s eye

    The shaded area of the forecast cone only represents where the hurricane center forecasts the eye of the storm to go over. It has nothing to do with who will feel the impacts of the rain, wind or storm surge.

    As we know, New Jersey experiences rough seas and large swells from tropical cyclones hundreds of miles away. Just last week, the week of Aug. 4, there were dangerous rip currents all over the Jersey Shore from Tropical Storm Dexter, which was never closer than 450 miles from the coastline here.

    The center line does not represent storm path probability

    The weather community has mostly moved away from showing the “center” line in the hurricane outlooks. It’s usually the line that connects the dots or symbols that show where the storm is forecasted to be located at a certain time.

    There’s a good reason for it, too. The center line doesn’t mean anything except simply where the center of the cone is now. It doesn’t mean the hurricane center is most confident about it hitting there in the future.

    Let’s use Superstorm Sandy in 2012 as an example. Three days before the storm, the center line was in the Delaware Bay. Turns out, it made landfall roughly 50 miles north of there, in Brigantine.

    Via the National Hurricane Center

    If the people making decisions on evacuations and emergency preparedness only used the center line, New York City and maybe Monmouth County wouldn’t have made the preparations that they did otherwise.

    The track forecast cone covers a five-day forecast

    The official forecast from the National Hurricanes Center covers a time span of five days. The location, storm strength, speed and pressure forecast are then given for 12, 24, 36, 48, 60, 72, 96 and 120 hours from the time of the forecast.

    You may see computer forecast models run online or on television. Commonly known as “spaghetti plots,” they either show one computer model with slightly different variations to give you a fuller picture of where the storm could go (ensemble forecast), or a host of different computer models plotted on one chart.

    While they’re fine to show, do not use this as official guidance in your thinking process. The only official source for hurricane track information is the National Hurricane Center.

    The track forecast cones widen over time due to growing uncertainty

    The further out from the current time you make a forecast, the more likely something in the forecast will change. You may also know this as the butterfly effect, made famous by the Meteorologist Ed Lorenz.

    The National Hurricane Center accounts for that by widening the forecast track as you go out from the 12- to 120-hour forecast. Here is how wide the eye of the storm track forecasts were in 2024.

    • 12-hour forecast: 26 nautical miles
    • 24-hour forecast: 39 nautical miles
    • 36-hour forecast: 52 nautical miles
    • 48-hour forecast: 67 nautical miles
    • 60-hour forecast: 83 nautical miles
    • 72-hour forecast: 100 nautical miles
    • 96-hour forecast: 142 nautical miles
    • 120-hour forecast: 213 nautical miles.

    For reference, the entire Jersey Shore, from Cape May to Sandy Hook, is 111 nautical miles.

    Forecasting the track of tropical cyclones has improved dramatically

    Due to massive upgrades in computer power, knowledge of meteorology and techniques, the track of Atlantic Basin hurricane forecasts is excellent. Here are a few facts that really stand out to me.

    Today’s 72-hour (three-day) hurricane forecasts in 2024 are as accurate as the 24-hour forecasts were in 2000.

    The 120-hour (five-day) hurricane forecasts in 2024 are as accurate as the 48-hour forecasts in 2000, and even the 72-hour forecasts during Superstorm Sandy in 2012, demonstrating significant progress in extended-range forecasting.

    And my favorite, our five-day hurricane forecasts in 2024 are as accurate as the 24-hour forecasts were in 1970. The Pacific Ocean has seen a similar, vast improvement.

    There’s been a vast improvement in the forecast of a tropical cyclone’s path in recent decades. (Via National Hurricane Center)

    In other words, we have reduced the number of false alarms for evacuations and improved the ability to confidently issue evacuations in recent decades.

    The track forecast cone is a 60-70% probability

    While the weather community has made tremendous gains in tropical cyclone forecasting, the tropical cyclone is expected to remain within the track 60-70% of the time. Upperclassman-level high-school math is used to come to this conclusion. However, the hurricane center uses this probability to strike a balance between the hurricane’s potential path, and accounting for the uncertainty you get the further out you go.

    Opinion: The track forecast cone should show the 75% probability

    The National Hurricane Center has made tremendous progress in forecasting the track of tropical storms or hurricanes. At the same time, if you weren’t reading Shore Local, you’d have to dig through the internet to find that the cone you see has only a 60-70% probability of it happening. Therefore, to be more accurate, while also understanding the social science of how the cone is perceived, I believe it’s time to make the forecast cone bigger.

    By going to a 75% probability, the storm you’re tracking has a 3 out of 4 chance of being within that forecast.

    I asked AI (Grok) to compute the width of the forecast track cone if we used a 75% probability. This is what it came up with, compared to what it is now, with the current probability.

    24-hour forecast: 45 nautical miles vs. 39 nautical miles.

    120-hour forecast: 245 nautical miles vs. 213 nautical miles.

    That would take us back to approximately the size of the forecast cone in 2010. For the increase in accuracy, I believe that’s a reasonable price to pay for getting it right more often.

    Would you support a forecast track cone size this big if it meant being 10 to 15% more accurate on the path?

    Joe Martucci, a Certified Broadcast Meteorologist and Digital Meteorologist, is the President and Director of Meteorology for Cup A Joe Weather and Drone. You can connect with him at cupajoe.sparkable.opalstacked.com/.