Tag: Jersey Shore

  • NJ Nor’easter brings top 10 highest tide, record rain, erosion

    NJ Nor’easter brings top 10 highest tide, record rain, erosion

    This article initially appeared in Shore Local magazine on Oct. 16

    It ripped, roared and, most consequentially, flooded. The first nor’easter of the 2025-2026 cool-weather season may very well turn out to be the most powerful one. Here are the most impressive storm stats to me for the Jersey Shore and beyond.

    – The Sunday or Monday afternoon high tide was in the top 10 highest on record for nearly everywhere, from Cape May up to southern Monmouth County, according to the National Oceanic and Atmospheric Administration.

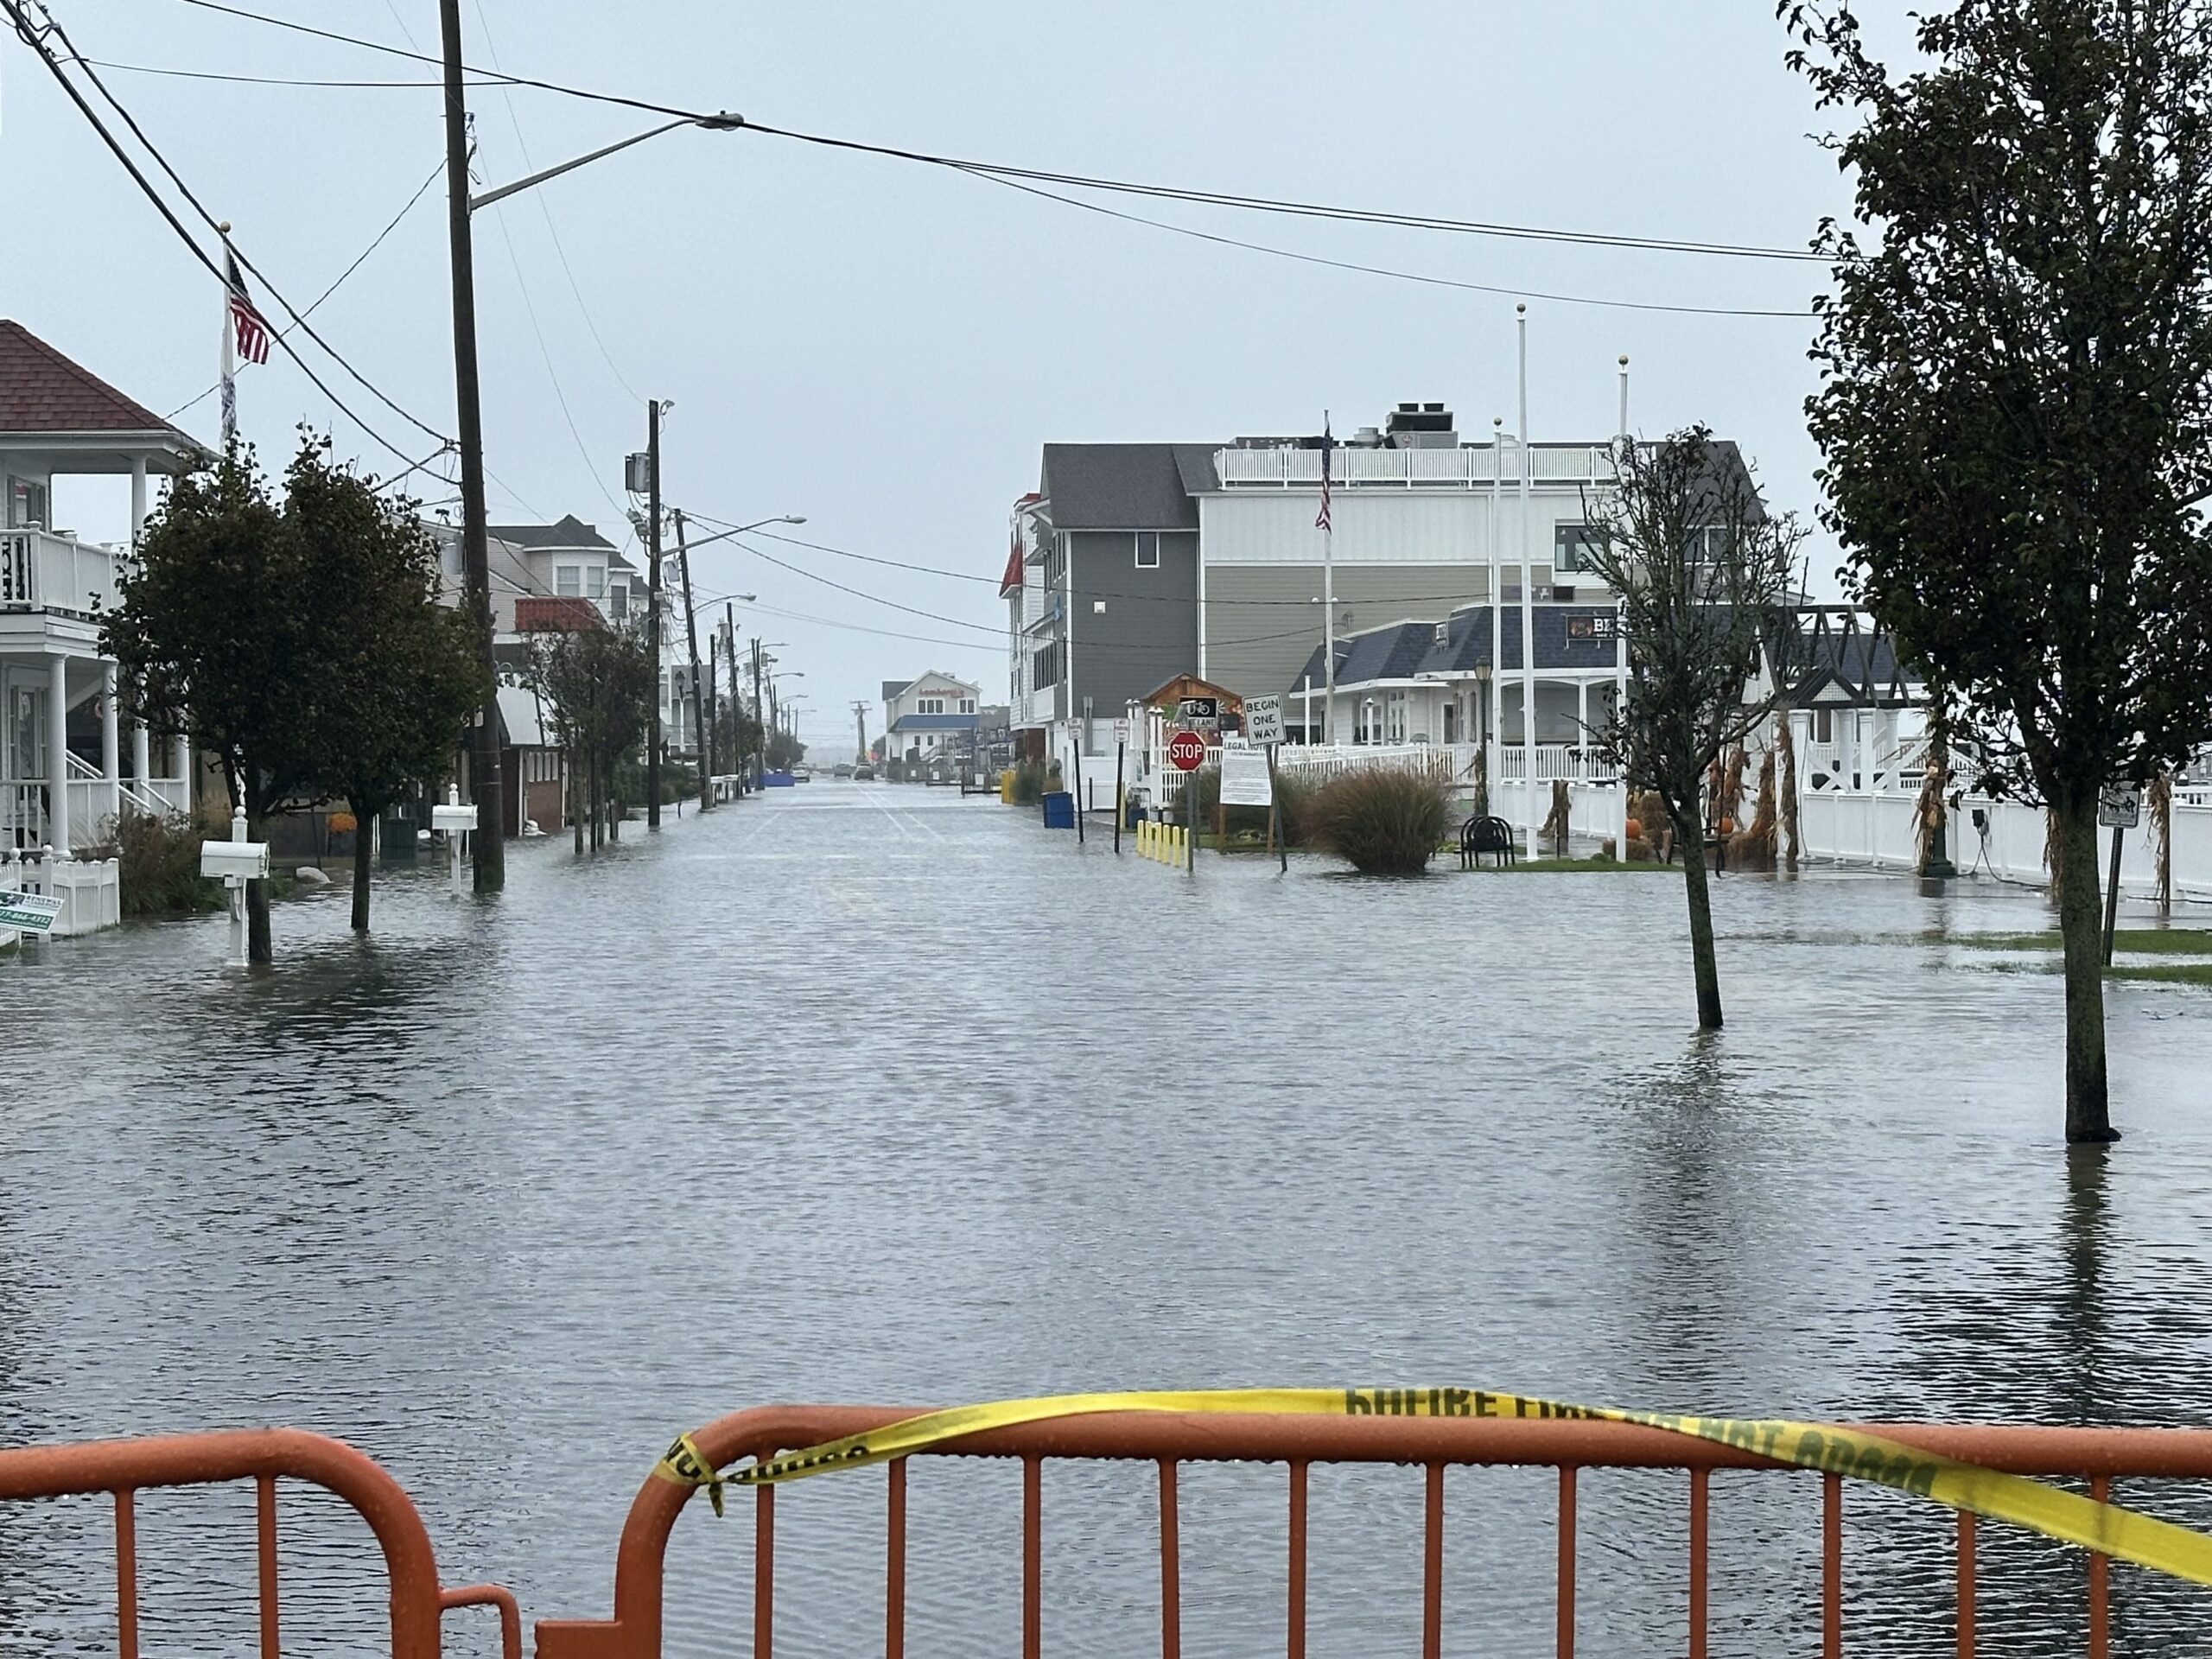
    – Most of Cape May and Atlantic counties saw three consecutive tides in moderate flood stage.

    – Sen. Frank S. Farley State Marina broke a daily rainfall record that had stood since 1927.

    Plus, while we will remember this as a nor’easter, there were tropical characteristics to this storm, too. Let’s explain the details for all of this.

    How severe were the tides at the Jersey Shore?
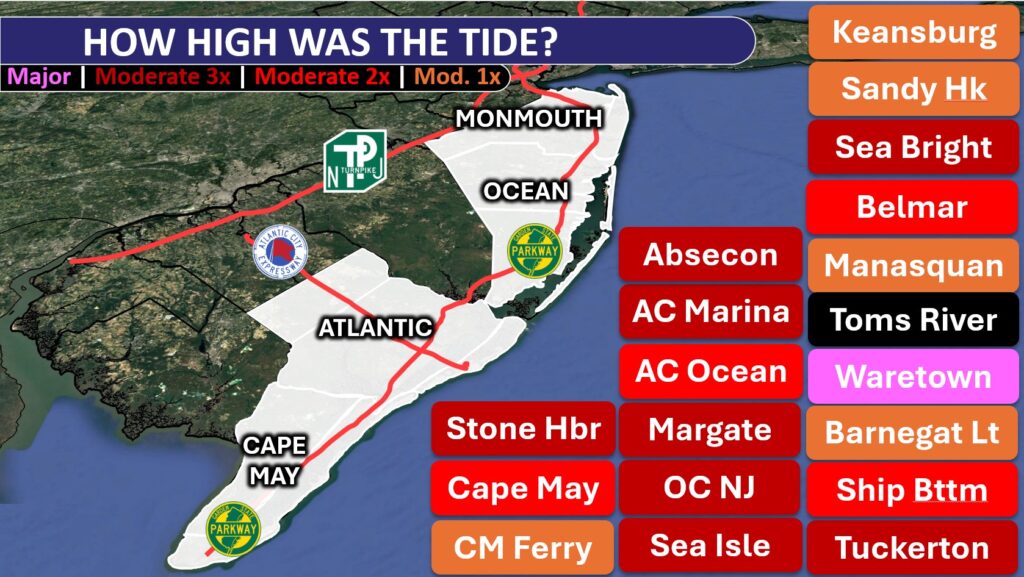
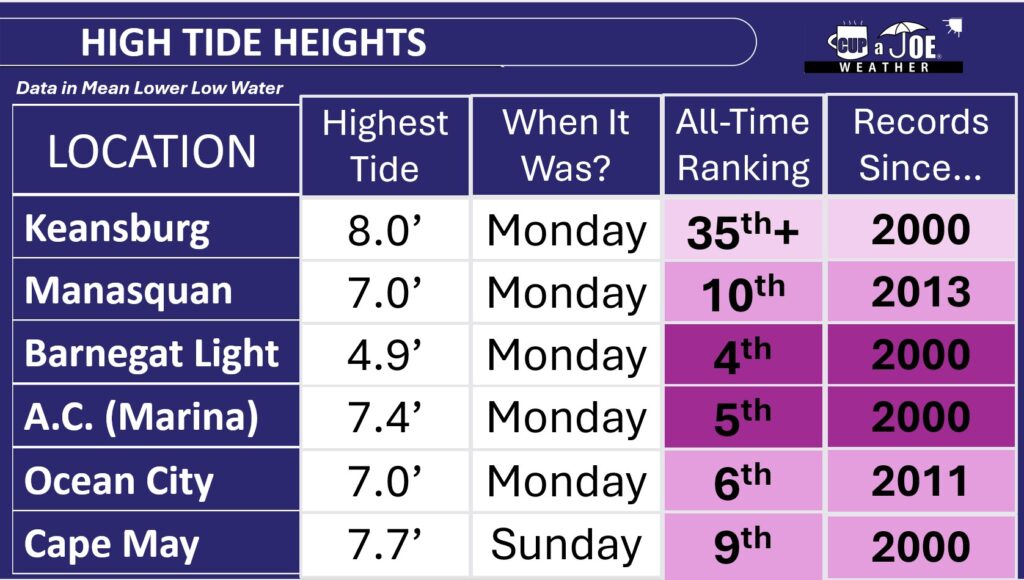
    Atlantic City Marina had its fifth highest tide on record, peaking at 7.4 feet above mean lower low water, the average height of the two lowest low tides Monday afternoon.

    Ocean City had its sixth highest tide on record, reaching 7.0 feet above mean lower low water Monday.

    Down near Exit 0 in Cape May, the ninth highest tide on record, peaking at 7.7 feet above mean lower low water, was experienced on Sunday.

    Ocean County ended up having the highest tides. Barnegat Light in the northern part of Long Beach Island, had the fourth highest tide on record. Meanwhile, across the Barnegat Bay in Waretown, 3 feet of water was recorded in the lowest-lying areas — their worst recorded tide.
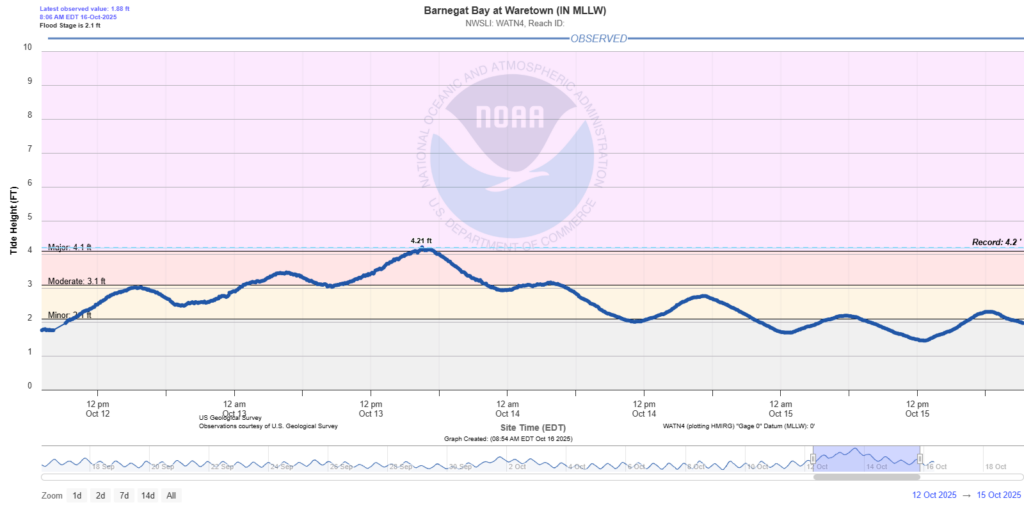
    Tide heights in Waretown, Ocean County, on the Barnegat Bay from Oct. 12 to Oct. 15. The 4.21 foot above mean lower low water is the highest in its recorded history (data via the National Oceanic and Atmospheric Administration).

    Farther north Manasquan, Monmouth County, had its 10th highest tide. The least severe flooding was on the Raritan Bayshore. They stayed in minor flood stage.

    There is a caveat to all of this. These records only go back to 2000 at the earliest. So it doesn’t count the 1991 or 1992 nor’easters, the 1962 Ash Wednesday storm or the 1944 hurricane, among others. However, there have been roughly 9,100 days between 2000 and fall 2025. This tide ranks in the top 0.1%. That’s impressive.
    To put things in perspective, it helps to have a recent event with which to compare the storm, so let’s consider Hurricane Erin.

    In late August, Erin brought the highest storm surge on record to the following locations: Absecon, Atlantic City (Inside Thorofare), Sea Isle City, Avalon, Stone Harbor and Cape May (bayside), according to NOAA.

    For the South Jersey shore, south of Long Beach Island, the highest tide stayed near Erin’s height, whether it happened on Sunday or Monday afternoon. North of LBI, at least one of the two tides from the nor’easter were higher than Erin.
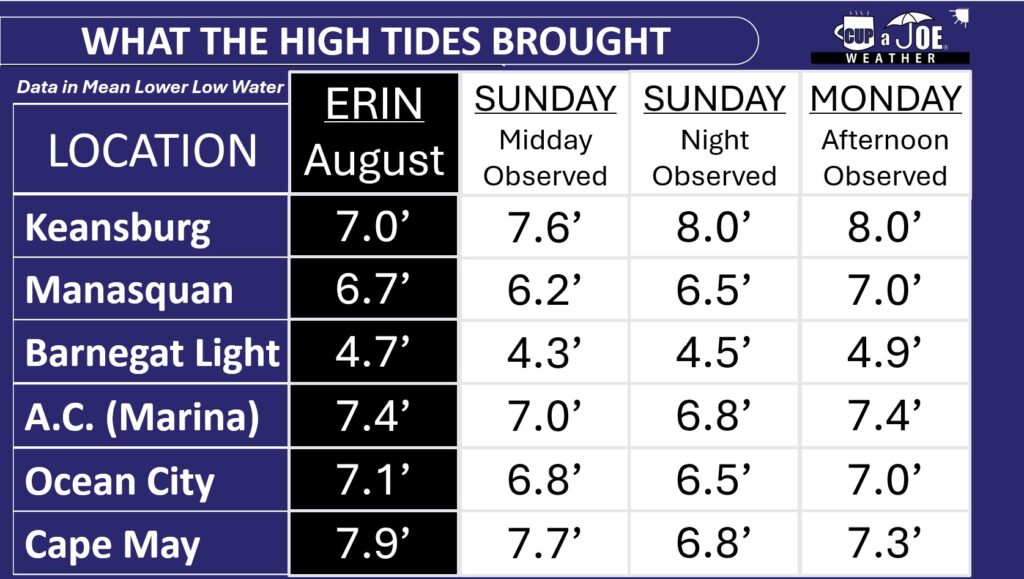
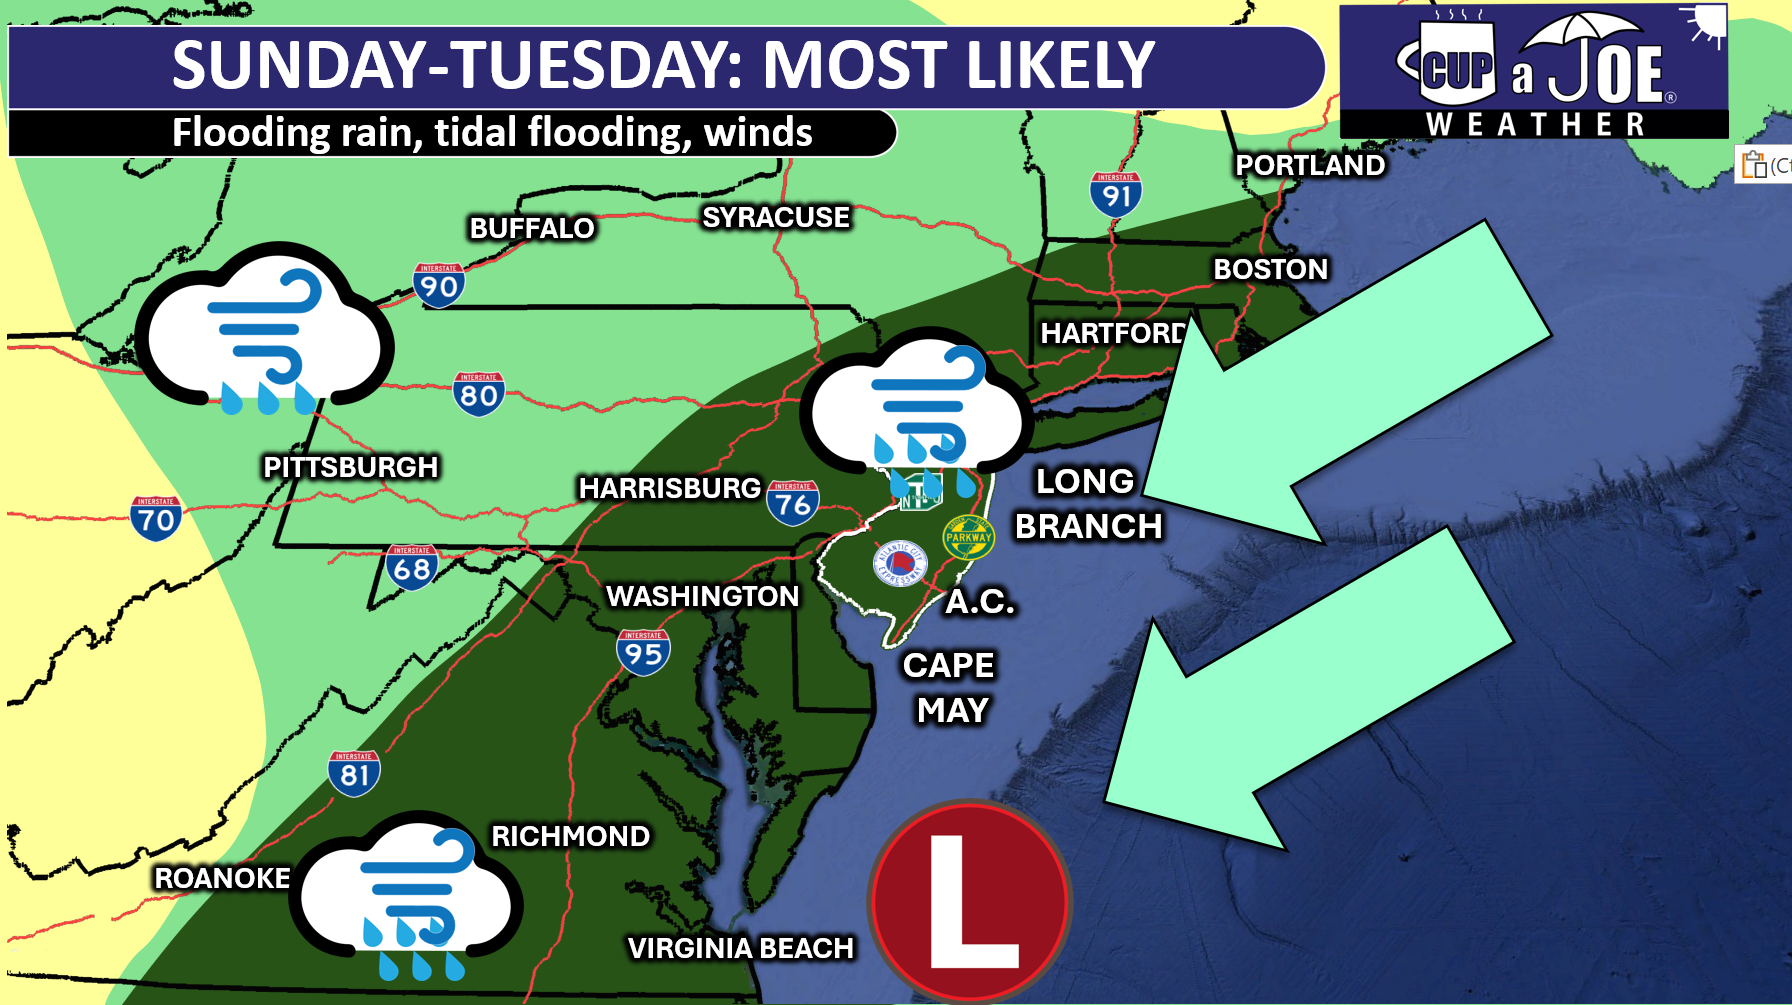
    The South Jersey shore could have been worse. Thankfully, winds on Monday morning were from the northwest — offshore — which pushed some of the water out. Had they been northeast, like the rest of the Jersey Shore was, towns like Ocean City and Somers Point would have had tides higher than Erin on Monday afternoon, pushing into major flood territory.

    How much beach erosion occurred at the Jersey Shore?

    The exact details won’t be known until towns and the Army Corps of Engineers complete their post-storm surveys. However, expect to hear that issues are widespread and severe for a few.

    Towns already have stark cliffs of sand on the beach from Erin in August. Tack on additional erosion from a storm in September, and our sand infrastructure was already worse than it would be this time of the year going into the Oct. 12-13 storm.

    I imagine every beach town has more erosion than they’d like to stomach for it being so early in the erosion season. Hopefully, this winter and next spring will have fewer nor’easters than usual.

    Gusts over 60 mph

    Wind gusts over 45 mph were widespread east of the Garden State Parkway, and on the bayshores. Island Beach State Park in Ocean County had the highest reported wind gusts, with 62 mph recorded at an Office of the New Jersey State Climatologist weather station. However, Avalon in Cape May County and Surf City in Ocean County also touched 60 mph.

    Here are some other top gusts:

    Atlantic City – 56 mph

    Brigantine – 52 mph

    Cape May Harbor – 52 mph

    Ocean City – 50 mph
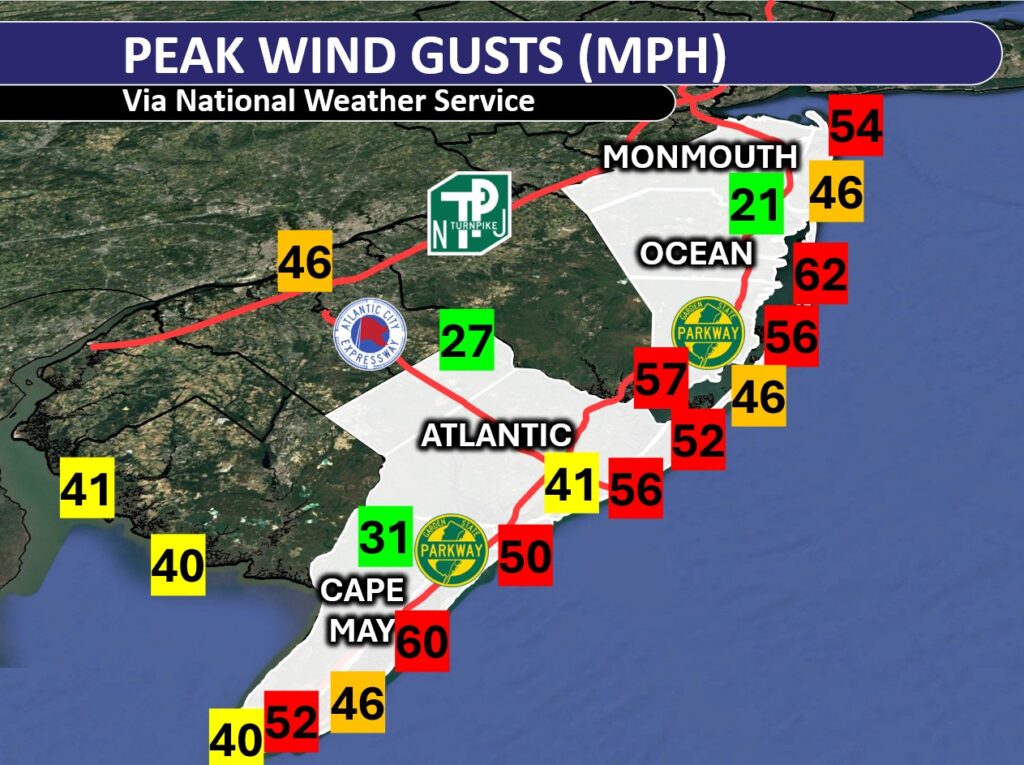
    The sustained winds, or constantly blowing ones, made for whistling trees and rattling outdoor furniture Sunday and Monday. Generally, it was 20 to 30 mph at the shore.

    Gusts were much weaker inland. Woodbine in Cape May County reached 31 mph, and Hammonton in Atlantic County only got up to 27 mph.

    Rain was heavy, too

    Rain was the least of our concerns with this storm, but we still had a soaking; that is, east of the Garden State Parkway. Atlantic City Marina broke an Oct. 13 daily rainfall record with 2.11 inches of rain, beating the previous record set back in 1927, according to the NOAA.
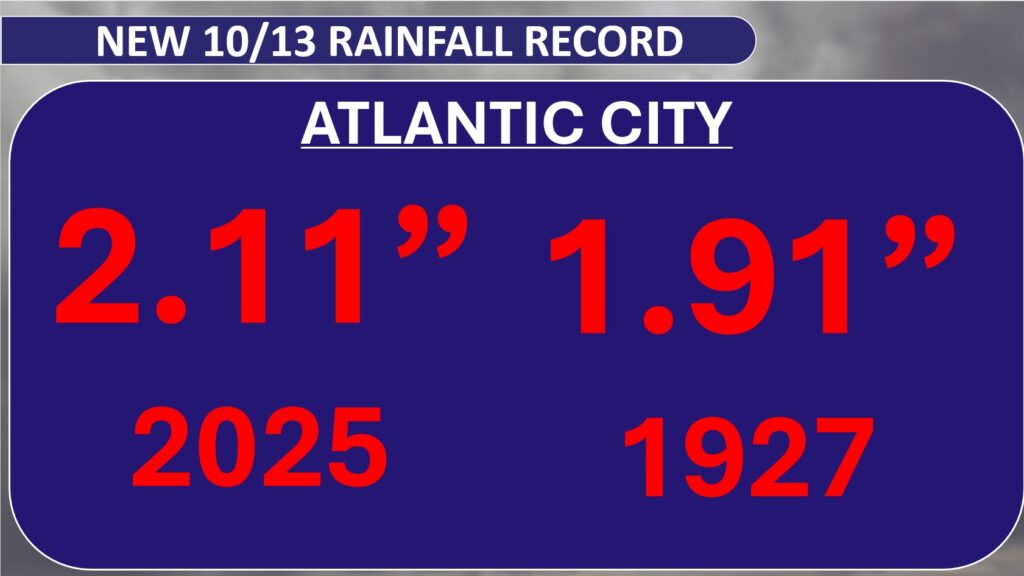
    Generally, rainfall totals were between 2 and 3 inches in Atlantic County. Cape May County generally had 1 to 2 inches of rain.

    Once you got away from the four coastal counties — Cape May, Atlantic, Ocean and Monmouth — rainfall measured only up to an inch. Out near Trenton and Philadelphia, it was less than a half inch.

    Jersey Shore streaming weather channel

    I am targeting a launch date between Oct. 18 to 21 for the Jersey Shore’s streaming weather channel. Thanks to Sparkable (who also run the Shore Local website), everything Jersey Shore weather, with a little drone, will be on my YouTube channel and website for your viewing pleasure.

    Tide and marine forecasts, current conditions, forecast videos, radar and support from our sponsors will all be on there. I also want to see your Jersey Shore photos! Submit your sunrises, snow, thunderstorms and fall foliage to be featured in a special shot on the livestream.

    Keep it on your smart TV or computer all day long. Stay tuned for more details.
  • Why the Oct. 2025 nor’easter was UNUSUAL for NJ

    Why the Oct. 2025 nor’easter was UNUSUAL for NJ

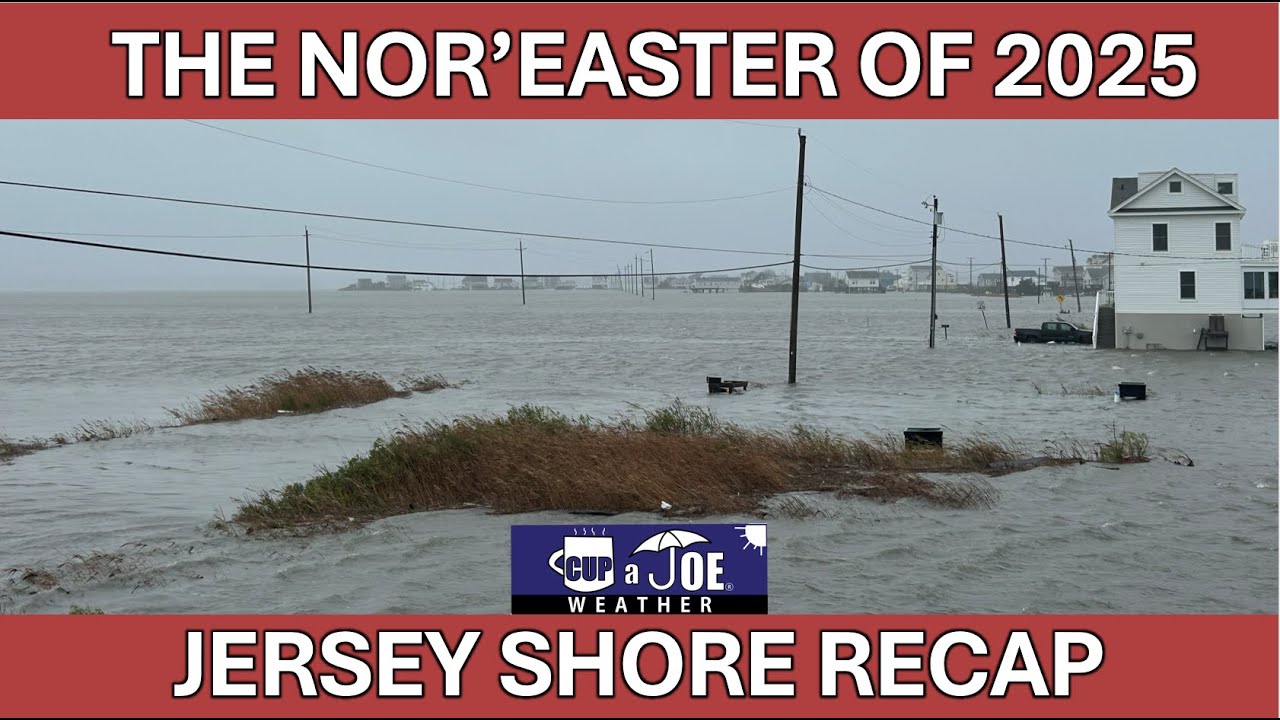
    It ripped, roared and broke records. The October 12-14, 2025 nor’easter brought a top 10 21st century tide to the Jersey Shore, and a daily rainfall record to Atlantic City Marina. From Highlands to the Wildwoods, we cover it all here!

    Follow my work: www.cupajoe.live
    Jolt your brand, advertise with me: joe@cupajoe.live

  • 🍁On the cusp of PEAK fall foliage | Thursday, 10/16/2025 NJ Weather forecast

    🍁On the cusp of PEAK fall foliage | Thursday, 10/16/2025 NJ Weather forecast

    THURSDAY’S FORECAST: It’s cool, it’s crisp, it’s bright, it’s peak fall weather now. These cool morning will speed up the Fall Foliage process. We’re near peak in parts of NJ. One thing your generic weather app won’t tell you? Where frost is possible Saturday morning.

    Follow my work: www.cupajoe.live
    Jolt your brand, advertise with me: joe@cupajoe.live

  • Our nor’easter is 95% over. | Wednesday, 10/15/2025 NJ Weather Forecast

    Our nor’easter is 95% over. | Wednesday, 10/15/2025 NJ Weather Forecast

    📹 WEDNESDAY’S FORECAST | Our nor’easter is like 99% done. One more round of tidal flooding in Ocean County and that’s it! One thing your generic weather app won’t tell you? The risk of wildfires today. Tune in!

    Follow my work: www.cupajoe.live 
    Jolt your brand, advertise with me: joe@cupajoe.live

  • 🥴More flooding, some rain | Tuesday NJ Nor’easter Update (10/14/2025)

    🥴More flooding, some rain | Tuesday NJ Nor’easter Update (10/14/2025)

    📹NOR’EASTER NOT DONE | We’re not out of the nor’easter yet. Coastal flooding continues on the back bays and moderate flood stage threatens in Ocean County. Elsewhere, it’s gloomy and gray with a few rain showers. However, there is light (sun!) at the end of the tunnel. Dominate your fantasy leagues and bets with weather-driven data.

    MeteoOdds gives you innovative tools, player/game weather impacts, and detailed forecasts. Join FF+ by using the code WEATHER and get 50% off, for life! Turn forecasts into fantasy wins — only at www.meteoodds.com.

  • The flooding was bad in Shark River Hills from this NJ nor’easter…

    The flooding was bad in Shark River Hills from this NJ nor’easter…

    Follow my work: www.cupajoe.live

    Jolt your brand, advertise with me: joe@cupajoe.live

  • ⚠️Monday Morning NJ Nor’easter Update (10/13/2025)

    ⚠️Monday Morning NJ Nor’easter Update (10/13/2025)

    ⚠ MONDAY AM NOR’EASTER FORECAST | Yes, this is a 6 minute video. There is a low to talk about. I believe many of your questions will be answered here. If you flooded last night, you’ll have more flooding this afternoon. If you didn’t flood last night, you might very well flood this afternoon. Inland? It’s raw and windy, but *low* impact.

    Never worry about missing severe weather warnings again. Get a recorded call from me when your location is impacted. WeatherCall ensures you stay informed for just $15 a year. Sign up: https://ngorder.wxriskalerts.com/db_app2.php?station=cajx

  • Friday Night NJ Nor’easter update: Tidal flooding HIGHER than Erin likely

    Friday Night NJ Nor’easter update: Tidal flooding HIGHER than Erin likely


    – Flooding will be worse than Erin in August.
    – Tropical storm force winds possible at the coast
    – Low impact west of GSP, away from bays. Never worry about missing severe weather warnings again.

    Get a recorded call from me when your location is impacted. WeatherCall ensures you stay informed for just $15 a year. Sign up: https://ngorder.wxriskalerts.com/db_app2.php?station=cajx

  • 2025’s Ocean was so Warm in NJ, It Almost Broke a Record

    2025’s Ocean was so Warm in NJ, It Almost Broke a Record

    The summer tide came rolling in this year much warmer than 2024. In fact, the water we enjoyed was tropical enough to be one of the warmest on record at the Jersey Shore.

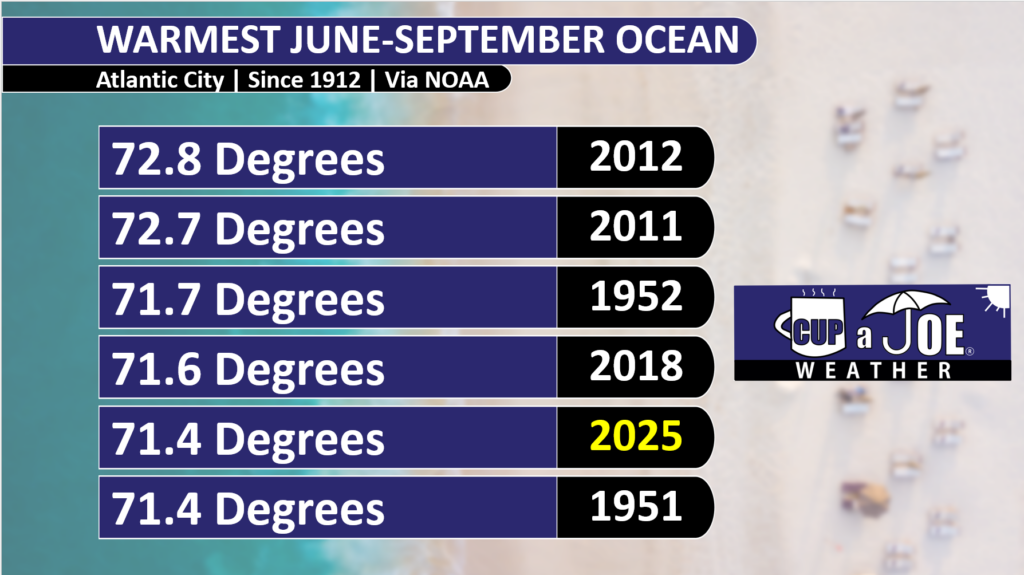
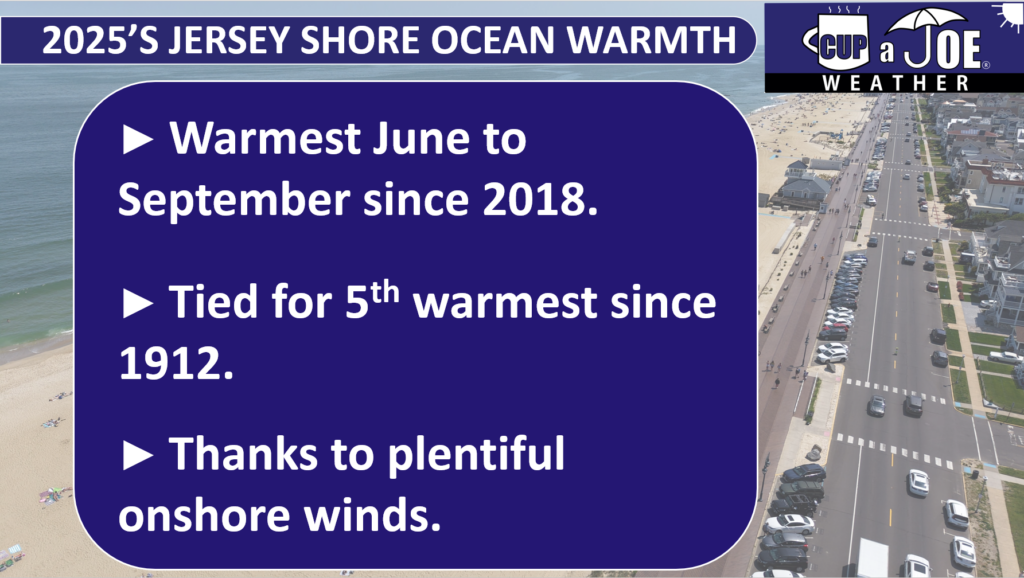
    From June to September, peak beach season, the ocean water temperature from the gauge at Atlantic City’s Steel Pier averaged 71.4 degrees. That is tied with 1951 for the fifth warmest season since records began in 1912.

    This was exactly five degrees warmer than last year, at 66.4 degrees. Remember last year? The water was cold. You sweated on the sand but shivered in the ocean.

    June and July had zero days with a water temperature above 75 degrees last year in Atlantic City. In fact, 11 July days were in the very chilly 50s, and 55 degrees was the 8 a.m. water temperature on July 18, 2024.

    The old saying, “life’s at ease with an ocean breeze” is true. Wind direction all summer, and Locals’ Summer September long, play the critical role to this top five ranking.

    There are three main factors that drive water temperatures.

    The Sun: In spring and summer, the sun is higher in the sky, so it warms up the ocean water faster. In fall and winter, the sun is lower, so the water stays cooler.

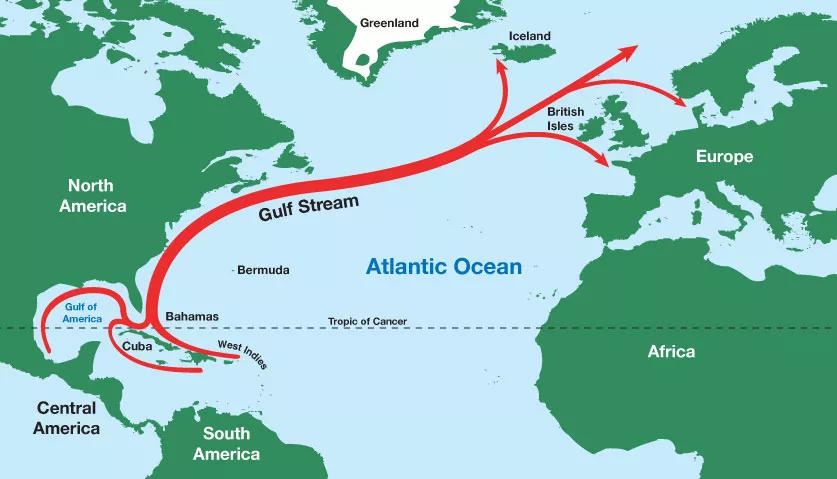
    The Currents: In New Jersey, there is a warm ocean current called the Gulf Stream. It starts near Florida and flows all the way to Europe. It does not always reach New Jersey, but sometimes its swirls, bringing warmer water to the shore.

    Wind Direction: Winds that blow from the east, called onshore winds, push warmer ocean water toward the beach. But winds from the south or southwest bring colder water. When winds blow along the shore, they can cause something called Ekman Pumping. This pushes warm surface water away and pulls up colder water from the bottom of the ocean, where we swim.

    While the sun and currents are constant, the wind direction varies day by day, month to month and, for purposes of this article, year by year. This is why it was warmer.

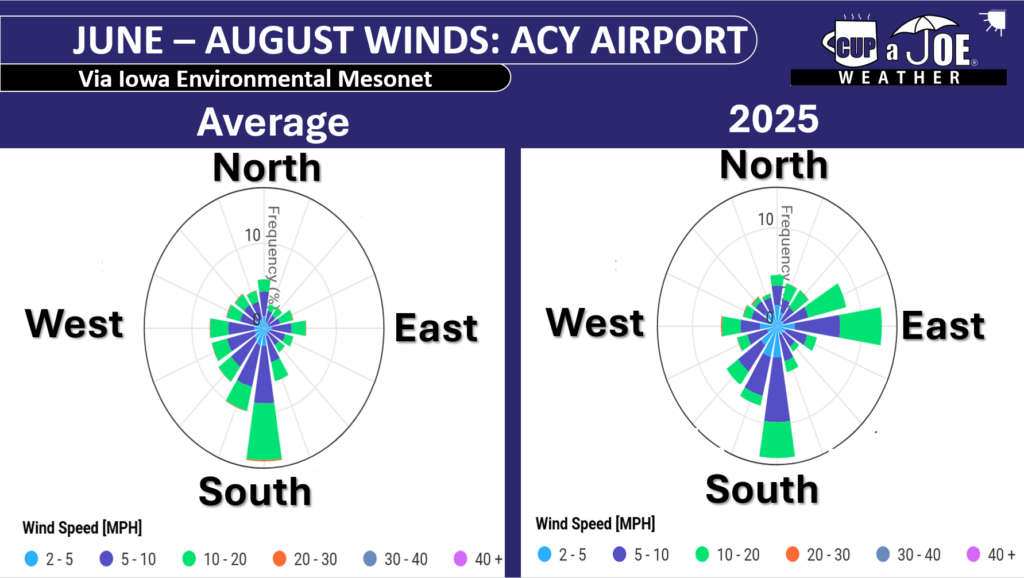
    Onshore winds blew 30% of the time between June and August at Atlantic City International Airport in Egg Harbor Township this year, our closest NOAA weather station with wind direction to Atlantic City.

    The average is 15%. In other words, we had double the number of onshore winds as usual.

    September was the same, with onshore winds roughly 38% of the time in 2025. 27% is the average.

    Those extra onshore winds pushed in some warmer water from the Gulf Stream and limited the amount of colder upwelling. It also led to an August that was cooler than average on land and just about average during September, according to New Jersey State Climatologist Dave Robinson, my other weather dad. Insert YouTube video here.

    The average June to September water temperature is 68.6 degrees. June was the only one below average, at 65.8 degrees. That is not a surprise. However, July (72.9), August (74.8), September (72.1) were all above average.

    If you had to compare it, the sea surface temperatures you experienced this season were more like an average season for Virginia Beach.

    August 16 and 17 were the warmest water days, staying above 80 degrees. June 1 itself had the coldest water, staying below 60 degrees. No surprise there, as the sun is trying to heat up the water.

    We are Going Live!

    Also, I am extremely excited to say that the Jersey Shore’s first 24×7 livestreaming weather channel is going live soon! Thanks to Sparkable (who also runs the Shore Local Website), everything Jersey Shore weather, with a little drone, will be on my YouTube channel and website for your viewing pleasure.

    Tide and marine forecasts, current conditions, forecast videos, radar, and support from our sponsors will all be on there. I also want to see your Jersey Shore photos! Submit your sunrises, snow, thunderstorms and fall foliage to be featured in a special shot on the livestream.

    Keep it on your smart TV or computer all day long. Stay tuned for more details.