Tag: meteorology

  • The 5 biggest updates from the National Hurricane Center you should know

    The 5 biggest updates from the National Hurricane Center you should know

    A mobile friendly website, tropical alerts inland from the coast, more clarification on what could be and what won’t be a tropical system an updated forecast cone and a major experimental change highlight the updated from the National Hurricane Center (NHC) in 2026.

    Every year, the National Hurricane Center rolls out a new list of operational (for official use) and experimental (for unofficial use) products and service.

    Some years, the updates are important, but technical. You won’t care unless you’re a Meteorologist or real weather-weenie.

    This year, though, the updates are visible, impactful and possibly paradigm changing.

    Let’s go through them, in no particular order.

    Inland tropical storm and hurricane alerts on the cone graphic are operational

    What started as an experiment in 2024 passed the public opinion and internal National Hurricane Center tests. Now, it’s for official use.

    When a tropical storm watch or warning, as well as a hurricane watch or warning is issued for a county inland of the coast (in New Jersey, think Mercer County) that will be shown on the forecast cone graphic.

    Before, if an inland county was in a hurricane or tropical storm alert, the graphic would not show it. Only a line corresponding with the color of the alert would be shown on the coastline. For example, a red line to denote a hurricane warning along the West Coast of Florida.
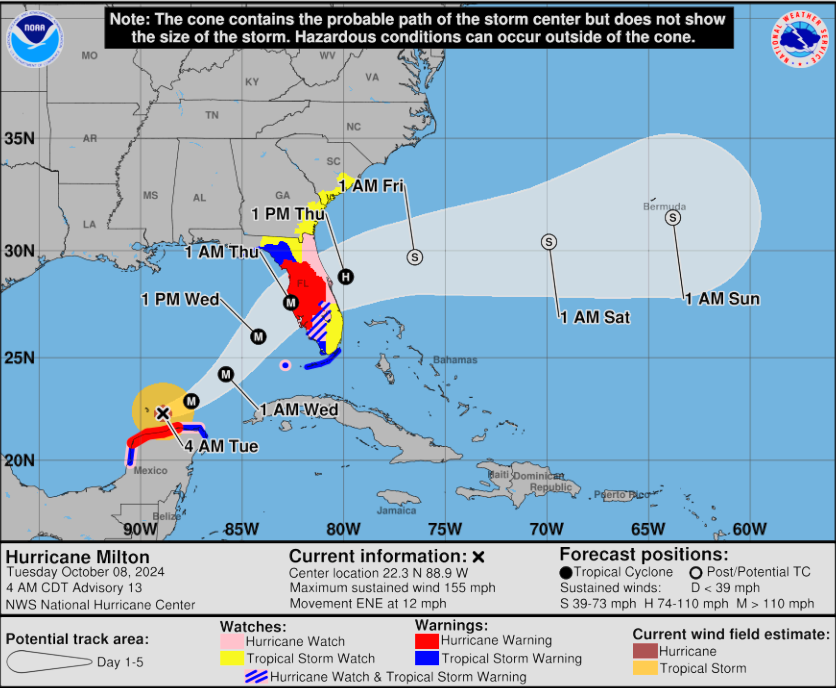
    The tropical forecast cone, the National Hurricane Center’s most popular tool, now will show tropical storm and hurricane alerts for inland counties. Before, only coastal county alerts were shown, even if inland counties were in an alert, too (via National Hurricane Center).

    “Recommendations from social science research suggest that the
    addition of inland watches and warnings to the cone graphic helps communicate wind risk
    during tropical cyclone events while not overcomplicating the graphic with too many data layers,” the NHC said about it.

    You can see the forecast cone by going to hurricanes.gov and clicking on the storm you’re interested in.

    The NHC gets a long overdue mobile page

    It’s not really the NHC’s fault, nor its parent organization, the National Oceanic and Atmospheric Administration’s (NOAA), for a lack of mobile device infrastructure (here’s a deep dive into why this is). However, the lack of a mobile site did make communication weather threats from America’s official source did complicate matters.

    Not anymore, though. https://www.nhc.noaa.gov/mobile/ is formatted for smartphones and tablets.

    Right at the top, you will see information on active tropical systems. Below that is the Graphical Tropical Weather Outlook for any of the three hurricane basins the NHC tracks (Central Pacific, Pacific and Atlantic) as well as at 2- and 7-day outlooks.

    All the way at the bottom are a collection of short-form, vertical videos they title “Building Your Hurricane Knowledge Kit”. This really brings the NHC into the 2020s, and beyond, asserting themselves as the official agency for hurricane information.
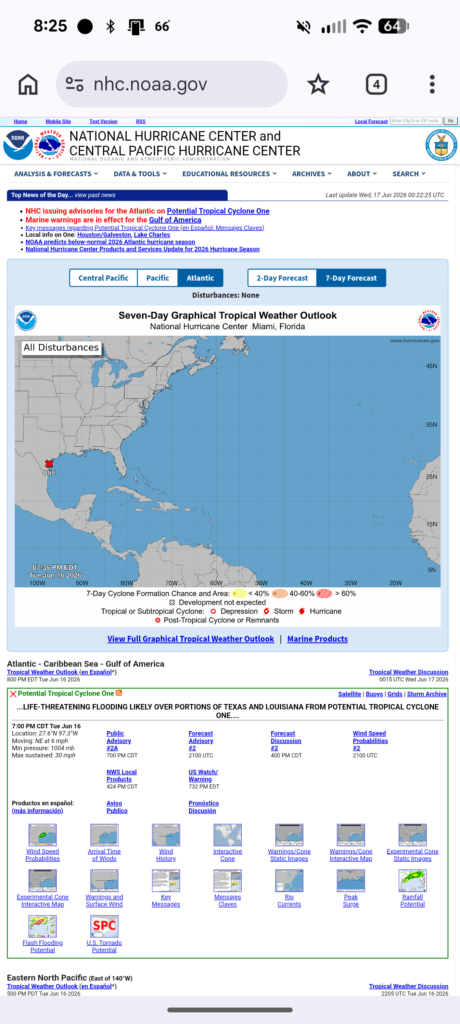
    The top half of the new National Hurricane Center mobile site.

    Storms with no chance of turning into a tropical system are separated out

    Before this year, the Graphical Tropical Weather Outlook showed all systems with a low chance of turning into a tropical cyclone as a yellow X. That even meant low pressure systems with a 0% chance.

    That changes in 2026. Systems with a near 0% chance of development in the 2-day period will be marked with a gray X.

    If the storm has a near 0% chance of development in the next 2-days but has a higher chance in the next 7-day, it will still be marked with a yellow X. On desktop, you’ll be able to hover over any X to see more information on it, including its chances for development in the next 2 or 7 days.
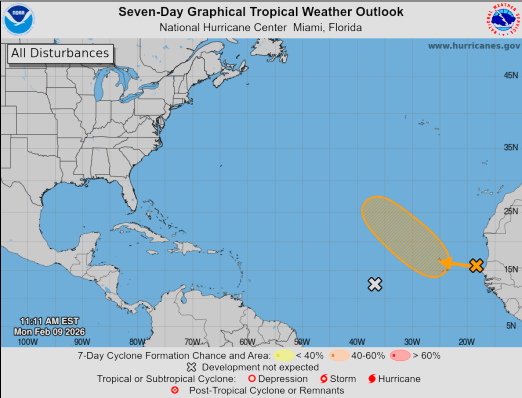
    This is an example of a 7-day tropical weather map. It shows a gray X. The gray X means there is almost no chance (near 0%) that the weather system will grow into a tropical storm or hurricane in the next 2 days or in the next 7 days. (via National Hurricane Center)

    This increases the communication ability of the NHC. Now, people won’t be misled about which systems can strengthen into a tropical system.

    The forecast track cone gets even more accurate

    The size of the forecast track cone, also known as the cone of uncertainty to some, continues to get smaller.

    In the Atlantic Hurricane Basin, the size of the cone is up to 8% smaller (at 48 and 60 hours out from when the forecast was made). The cone also gets smaller at hours 12, 36, 72, 96 and 120.

    The Pacific Hurricane Basin saw decreases up to 8% as well.
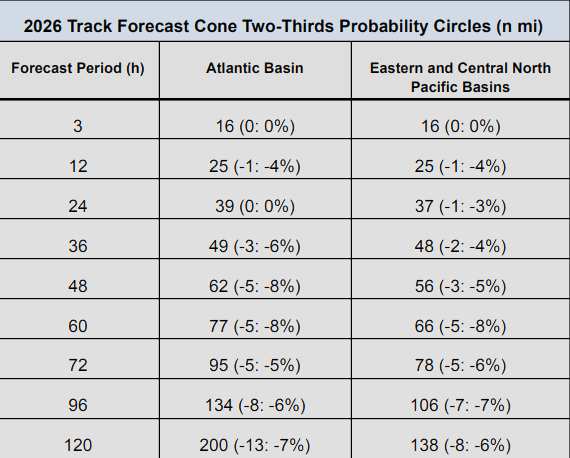
    2026 track forecast cone sizes at different hours out from the initial forecast. (National Hurricane Center).

    Even the forecast cone being 13 nautical miles smaller, like it is at hour 120 can be the difference between a small county like Union County, NJ being in a tropical storm watch, or nothing at all.

    The NHC determines the size of the cone by looking at the average of the forecast errors over the previous five years. The 2026 cone continues the near annual tradition of decreases in the size of the cone.

    Tomorrow marks 20 years since Hurricane Katrina hit New Orleans. ‪Brian McNoldy (@bmcnoldy.bsky.social‬) has a great visualization showing how much forecasts have improved over two decades: Purple = actual track forecast cone from 2005, and green = hypothetical forecast in 2025.

    John Bistline (@bistline.bsky.social) 2025-08-28T15:23:46.445Z

    However, there are two caveats to these improvements.

    1. Storm impacts can be felt outside of the cone. The cone only shows the forecast location of the eye of the tropical system.
    2. The forecast cone only shows the 66% likelihood of it happening. In other words, one of our every three storms has the cone outside of the cone.

    And that, is where perhaps the most consequential update on the science of tropical systems comes in.

    A new storm forecast cone is being experimented

    In 2026, the National Hurricane Center will begin testing a new experimental version of its famous hurricane track forecast cone.

    The cone graphic, which includes inland watches and warnings, will become operational that year.The current cone, first used in 2002, is made of circles drawn around forecast points.

    These circles are based on past errors and show where the storm center is expected to be about two-thirds of the time. The new cone will use oval shapes called ellipses instead of circles.
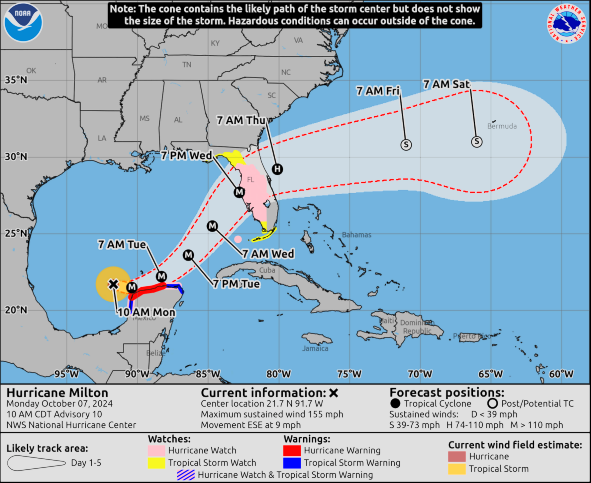
    Hurricane Milton (2024) track forecast cones: Red dashed line shows the current total-error cone. White shading shows the new cone based on direction and speed errors. The red line is for illustration only. (Via National Hurricane Center)

    These ellipses better show two types of errors: how fast or slow the storm moves (along-track) and how far it drifts left or right (cross-track). It will cover 90% of possible storm paths, giving a wider and clearer picture of risk.

    The experimental cone will be released shortly after each advisory. People will have a chance to give comments and feedback to help improve it.

    JOE’S OPINION: This has the potential to be a huge benefit for the American people, and the other countries that we help forecast for in the Caribbean, Bermuda, Central America and more.

    Last year, during our Tidal Flooding Talk show with Mike Brennan, Director, National Hurricane Center, I asked if it was time to make the forecast cone more accurate than the 66% probability that’s used.

    Tropical forecasting has improved so much since 2002 that I feel like we could do better as a community to give people more certainty, while not putting the entire East Coast into the forecast cone.

    Plus, be honest, how many of you really knew the forecast cone was only a two-thirds probability? Not many, I bet.

    Expanding this out to 90% probability makes this much more helpful as meteorologists communicate to emergency managers, elected leaders and more. They, in turn use their local knowledge to make safety decisions (like evacuations) and communicate them to the public.

    I wasn’t expecting the cone to take on a more oval shape. However, that’s an amazing bonus. It’s pretty well known in the weather world that the National Hurricane Center has progressed accurately forecasting the direction of a storm (cross-track) more than it’s speed (along-track). Though let me be clear, both have seen impressive improvements in the year 24 years.
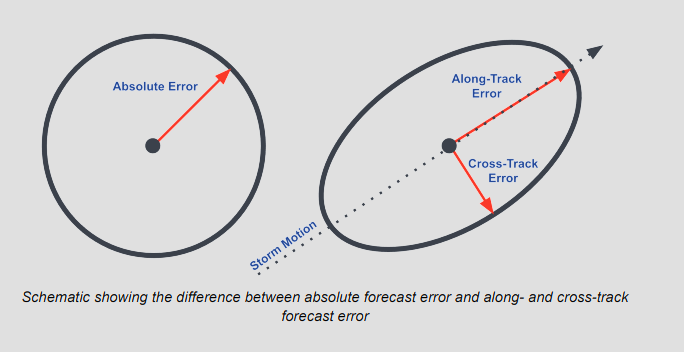
    Graphic showing difference between absolute forecast error and along- and cross-track forecast error (via National Hurricane Center)

    This won’t solve all issues. We will still deal with the fact that impacts still happen outside of the forecast cone. However, this answers many of the existent issues we have.

    While it’s experimental, you’ll be able to view it alongside the official forecast cone, with it’s two-thirds probability and more circular path. Typically, these are experimental for one to three years before becoming operational. So, look for this upgrade to be official between 2027-2029.

    More on hurricane season

    You can read the official press release on all of the updates from the National Hurricane Center here. The NHC is forecasting a less active than average season for the Atlantic Hurricane Basin, mainly due to the developing El Nino. However, it only takes one hurricane to strike you for you to remember it as an active season.
  • Pressure (The Movie): Among the most accurate weather movies ever.

    Pressure (The Movie): Among the most accurate weather movies ever.

    The perks of owning your own business: You can see the movie Pressure at 12:45PM on a Tuesday!

    Going to a movie at 12:45 p.m. on a Tuesday means a theatre empty enough to kick back and watch the film. (Eatontown, NJ AMC Theatre)

    Pressure is the movie about D-Day in World War II and how an accurate weather forecast changed the course of history. It really did. D-Day was supposed to be on June 5th. It ended up being June 6th.

    Here’s my (Joe Martucci’s) take.

    POSITIVES

    ✅ The weather terms they used were accurate.

    ✅ They really showed *how* much time and effort it took into forecasting. Back in the 1940s, there were no weather satellites, no weather radar and weather models took longer to run a forecast than the forecast hour itself. The movie showed a weather team of about 10 taking in calls about observations across the North Atlantic. Today, one person at a computer could get all of that info across.

    ✅ The tension between the American forecast and Scottish forecast was real. Capt. Krick used analogs to forecast future weather. That was a TON of work. He literally had to match up current conditions to all previous weather charts. Then, project forward for the forecast. That takes minutes with AI.

    Like the movie said, his method of forecasting worked in North Africa. The weather is more constant there. In Northern Europe, Dr. Stagg’s method was better.

    ✅The way Dr. Stagg gave his forecasts was PERFECT. Gen. Eienhower asked multiple sure if he was absolutely certain the stormy forecast would hold. He said no. We are predicting the future, not writing history. We can have high confidence but you’ll never have 100% accuracy, especially given it was 3 days out with 1940s tech.

    NOT SO GOOD

    ❌Some historical context was off. The rain actually started coming in on June 3rd, two days before the proposed June 5th date. The movie had it raining on June 4th.

    ❌Dr. Stagg never recommended June 18th as the next possible D-Day.

    OVERALL: This is up there with The Perfect Storm on the most weather accurate movies I’ve ever seen. I recommend!

    You can stream Pressure on Apple TV! Most movie theatres will end the airing of Pressure on June 19, 2026.

  • It’s sunny but tidal flooding continues for a FOURTH straight day

    It’s sunny but tidal flooding continues for a FOURTH straight day

    😎TUESDAY’S FORECAST | A chilly start gives way to a September like warm day at the shore! However, tidal flooding continues to show its ugly, watery head.

    Tired of water in your basement or crawlspace? Trust Finally Dry Waterproofing’s family-owned company to fix it right. We install permanent drainage solutions guaranteed for 2 ownerships with no limit! Get your FREE inspection at finallydrywaterproofing.net.

  • America’s Best Flood Mapper released to public in Avalon, NJ

    America’s Best Flood Mapper released to public in Avalon, NJ

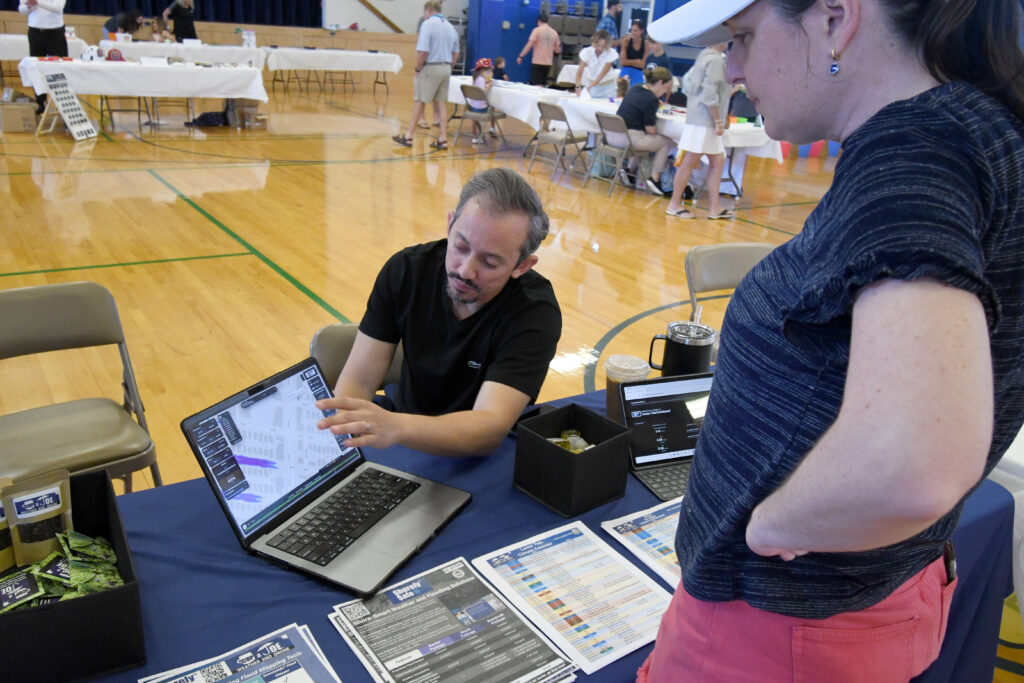
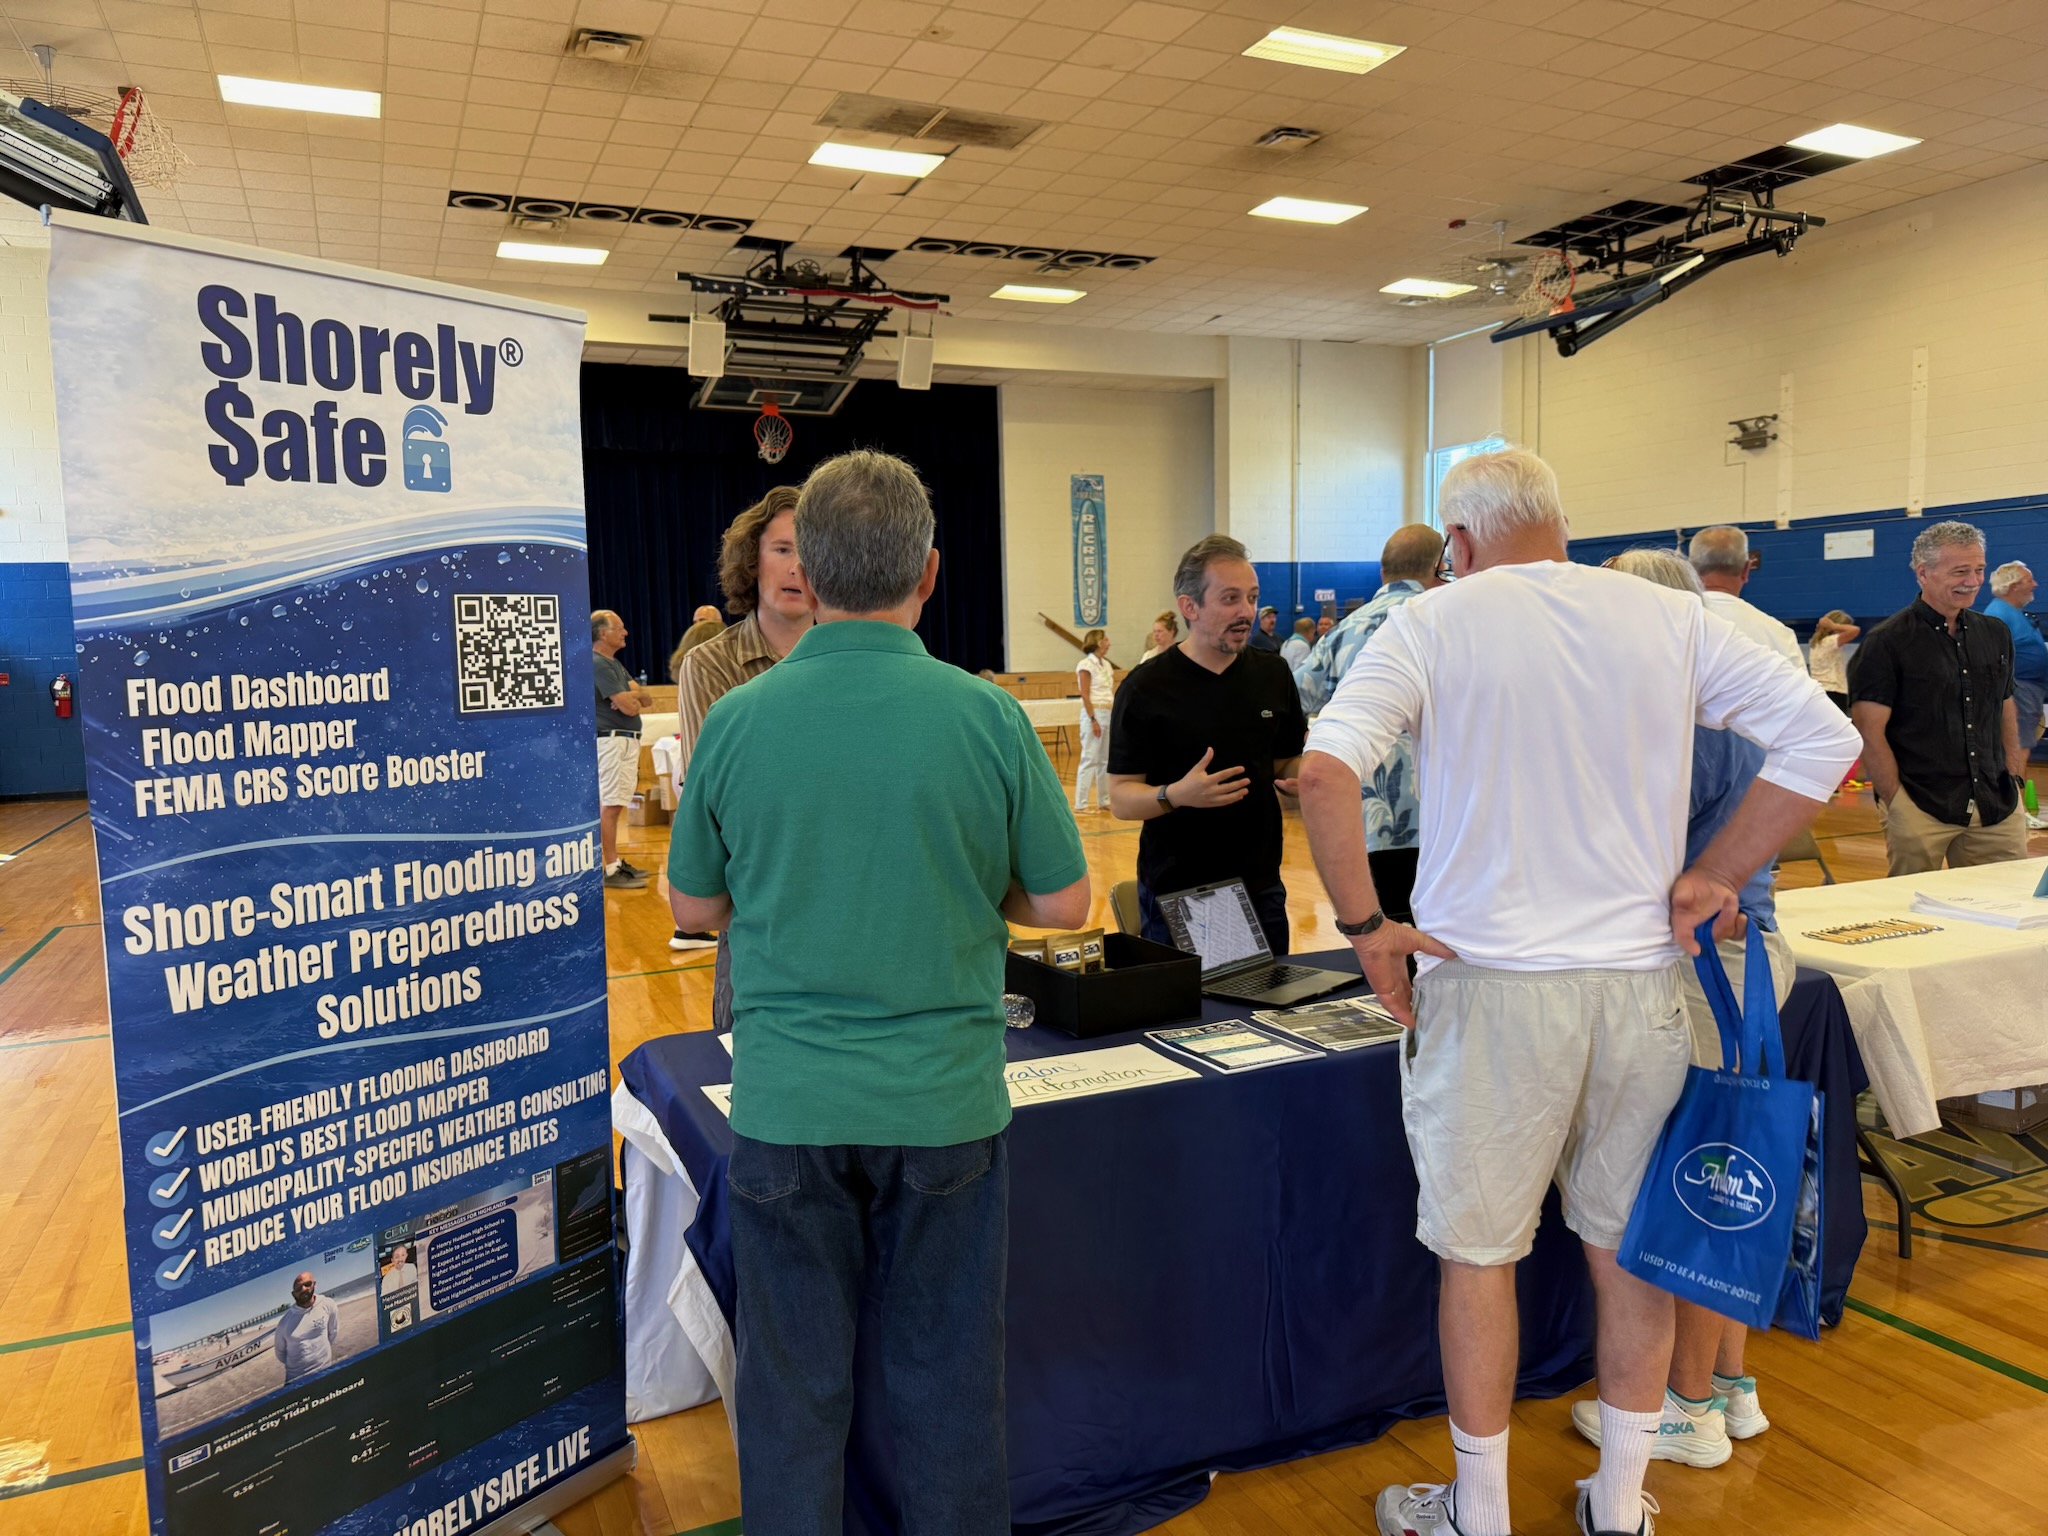
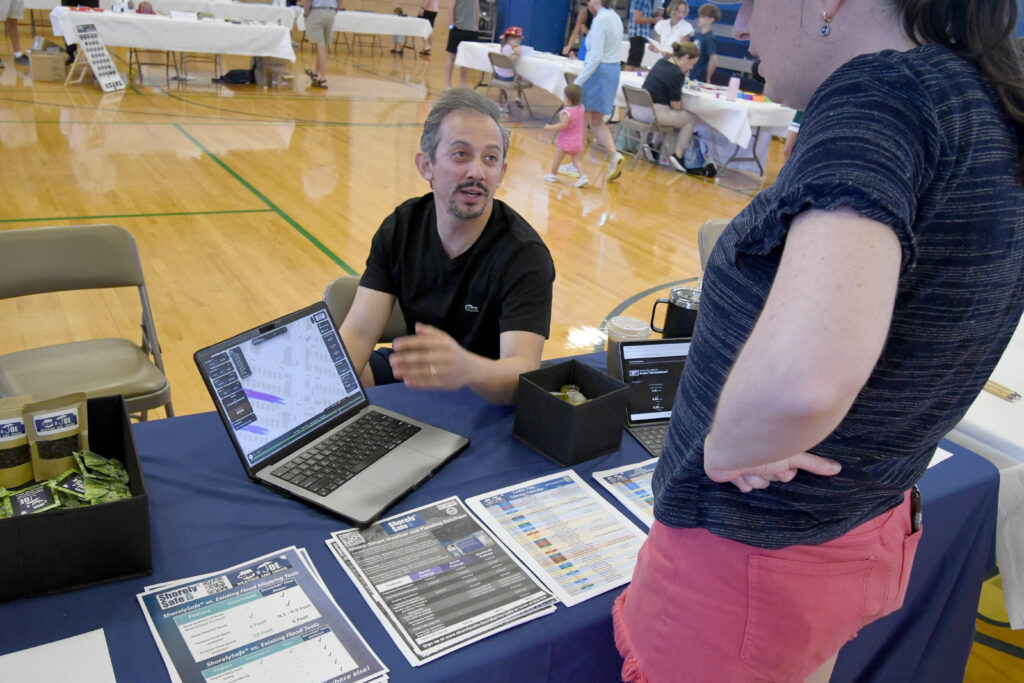
    ShorelySafe® was back in Avalon for the Avalon Home and Land Owners Association (AHOLA) community event!

    This was PJ Hondros and Joe Martucci‘s first in-person public showing of our in-house Flood Mapper and Flood Dashboard. Our Flood Mapper shows hourly forecast flooding, out to 72 hours, including its depth at unprecedented resolution.

    Based on the fact that people came to us to the whole 2 hours, wanting to see how much water was on their street for Sandy, the 1962 storm and more, it was a smashing success.

    Your County or Town can be ShorelySafe®, too! Tell your Mayor, Administration or Emergency Management Coordinator to email joe@cupajoe.live.

    Photos via Seven Mile Times and Thomas/Boyd Communications.

  • 🏖️Jersey Shore Weekend Weather Forecast for June 13-14, 2026

    🏖️Jersey Shore Weekend Weather Forecast for June 13-14, 2026

    SATURDAY’S FORECAST | It’s less heat and less humidity this weekend! However, coastal flooding rears its ugly head both days. Plus, you’ll need to pay attention to possible damaging winds and tornadoes Sunday.

    Come visit Headley Family Farm at 120 Province Road in West Creek! It’s where farming the pines meets the Jersey Shore. Get your Jersey Fresh produce here. Open weekends and some weekdays. Call us at 609-848-3763 or follow us on Facebook, too!

  • Hazy, hot and humid! But… will severe storms actually happen Friday?

    Hazy, hot and humid! But… will severe storms actually happen Friday?

    FRIDAY’S FORECAST | Hazy, hot and humid. Honestly, this forecast was pretty easy for me! It’s a repeat of Thursday. Getting severe storms would be different than yesterday, though. Here’s what I’m thinking on that.

    The weekend? Coastal flooding but less humid!

    Our 24×7 Jersey Shore Weather Channel: https://www.youtube.com/watch?v=dcPpb_VycOM

    Jolt your brand with the Shore’s top weather media company. Advertise today! joe@cupajoe.live

  • ⚠️”Extreme” Drought Returns to NJ and water restrictions may be next

    ⚠️”Extreme” Drought Returns to NJ and water restrictions may be next

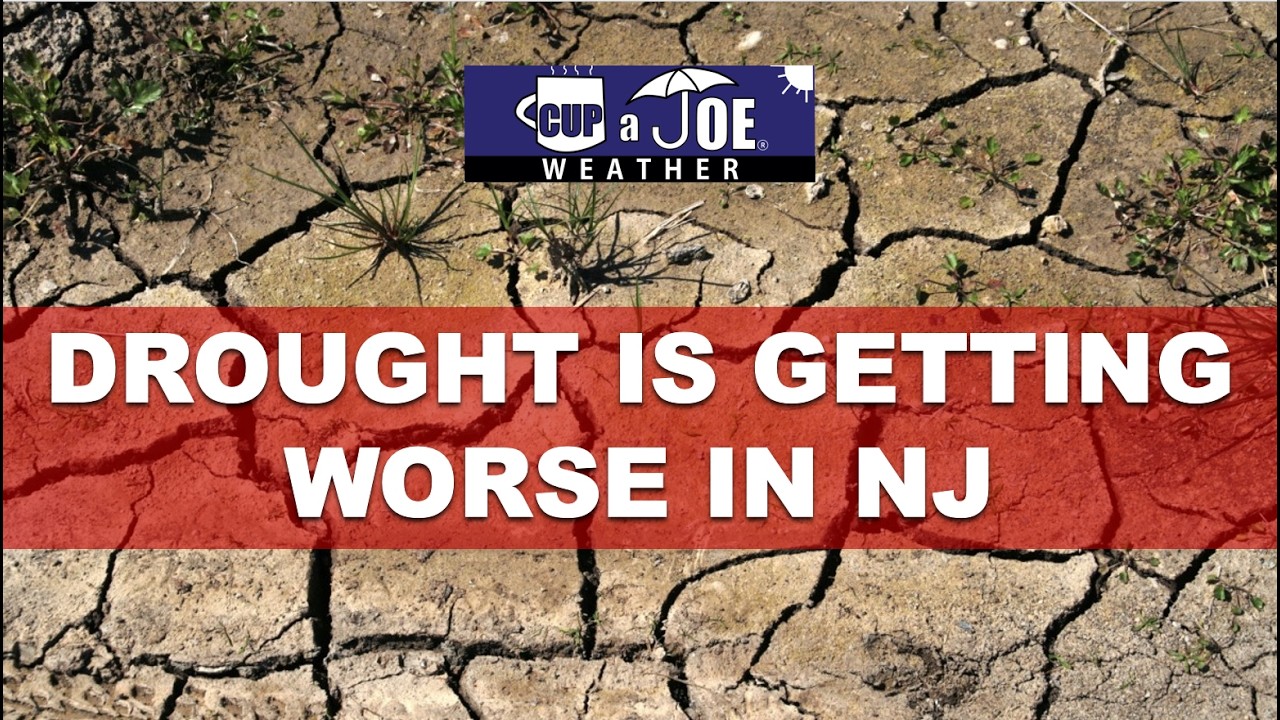
    Extreme (level 3/4) drought returned to NJ in Cape May and southern Cumberland counties, according to June 11th’s update from the United States Drought Monitor. It’s now the worst statewide drought since March 2025. However, with it being summer, and water usage at its peak for the year, mandatory water restrictions are closer than ever.

    Nancy Adler Nutrition has practiced nutrition weight loss, naturally, for 30 years . Listen every Saturday to Nancy Adler Nutrition Live Saturday 11AM-1PM on WOND radio. Ready to lose the weight? Call Nancy at 609-653-4900.

  • It’s getting hot, humid and stormy at the Jersey Shore

    It’s getting hot, humid and stormy at the Jersey Shore

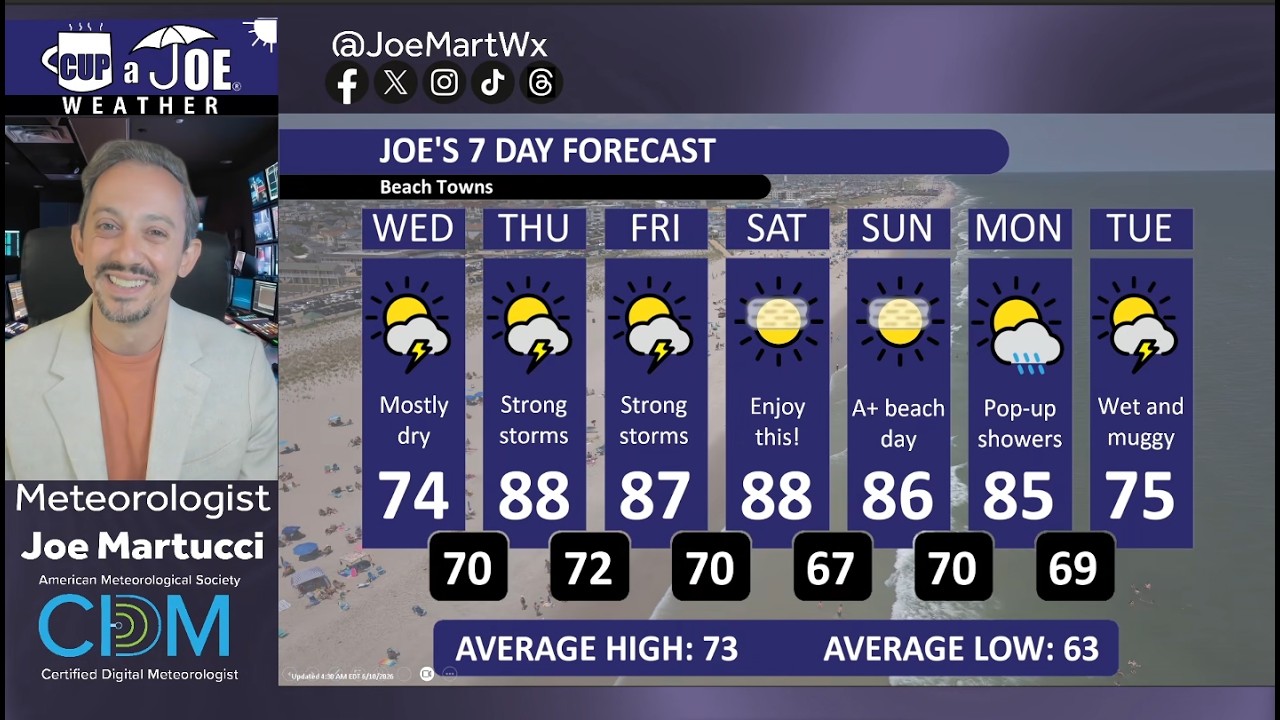
    WEDNESDAY’S FORECAST | Despite the gray sky, it is not a washout at the Jersey Shore today! About 1-2 wet hours are expected during the daytime. That’s it! Severe weather will threaten Thursday and Friday, though.

    Our 24×7 Jersey Shore Weather Channel: https://www.youtube.com/watch?v=dcPpb_VycOM

    Jolt your brand with the Shore’s top weather media company. Advertise today! joe@cupajoe.live

  • Why you didn’t see the Northern Lights in NJ this week

    Why you didn’t see the Northern Lights in NJ this week

    It’s hard to see the Northern Lights in NJ

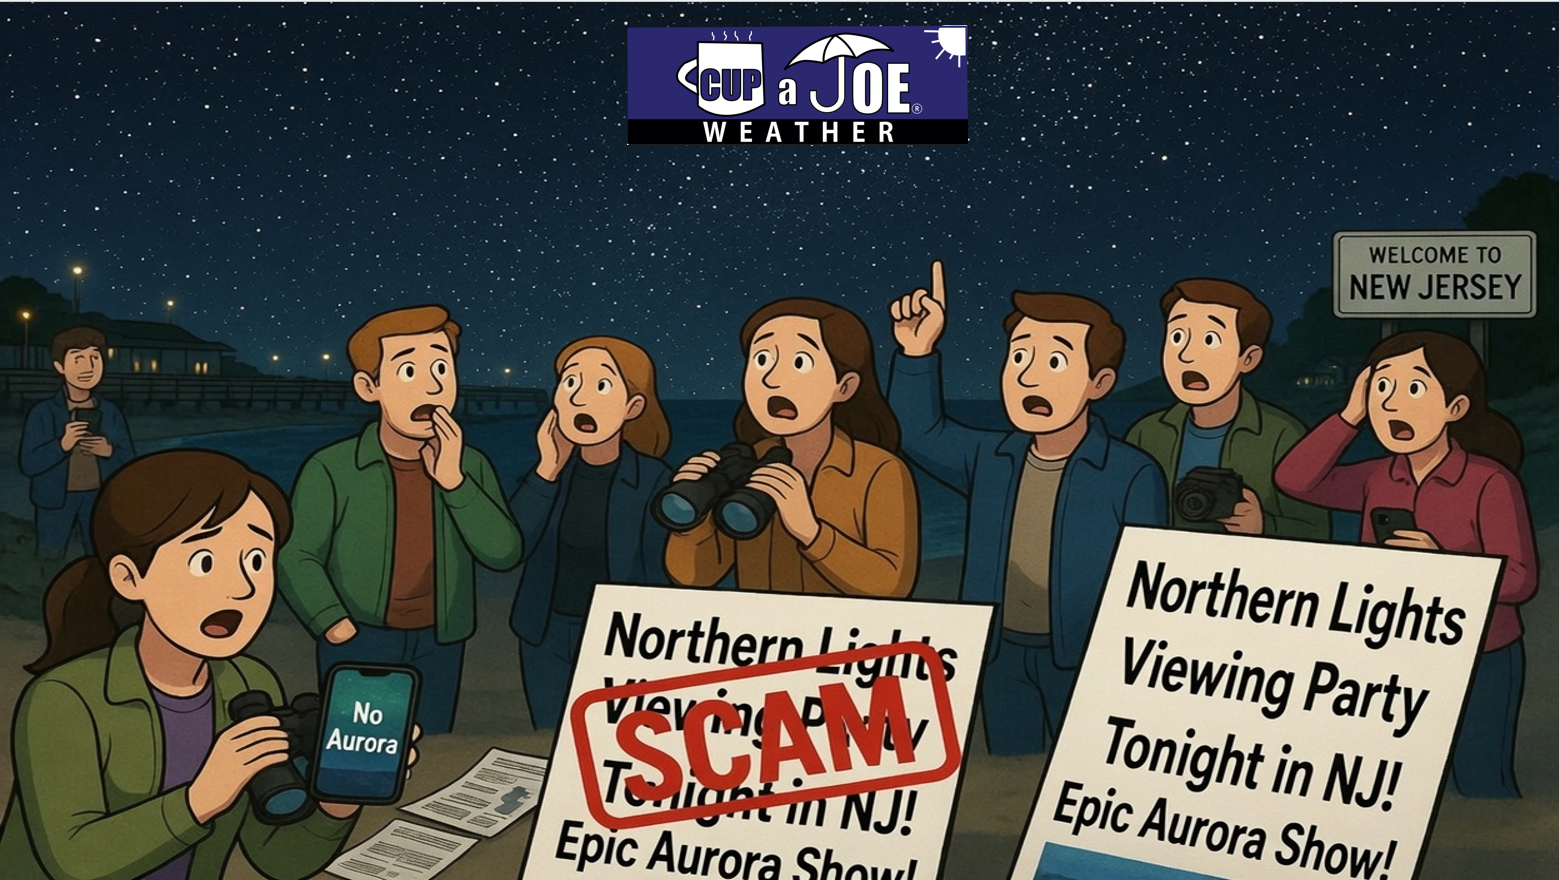
    On Sunday and Monday, photos circulated on the internet, saying North Jersey could see the Northern Lights with the naked eye while South Jersey would have it visible with a camera.

    What happened? No lights, just a dark, clear sky.

    Here’s the thing – Seeing the Northern Lights is HARD in NJ!

    Those maps were based off a G3 geomagnetic storm.

    Now, like hurricanes, you can go up to a category 5. In G3 storms, NOAA says the aurora, and this is important “has been seen as low as Illinois and Oregon”.

    However, that’s with a camera and low on the horizon. You can’t see it with your eyes and you’ll need to be on the beach or somewhere with a lot of open space to the north.

    The maps you saw online fudged the lines to make it looks like NYC, Philly, the big cities, would be in the action.

    In reality, you need a G4 geomagnetic storm to see it here. That was the kind that brought the dazzling colors in October 2024 and then last November, too.

    Like most things in life, know your sources, before posting and sharing.

  • 23 degrees! Why NJ gets HUGE temperature differences, like Tuesday.

    23 degrees! Why NJ gets HUGE temperature differences, like Tuesday.

    For such a small state, NJ has BIG differences in temperatures sometimes. We went from low 40s in the Pine Barrens to the low 60s near NYC! Why? High pressure, clear sky and calm wind. Let’s look at the microclimates.

    Sparkable is your full-service marketing department for your brand. From SEO to social media to website development, we deliver innovative strategies to elevate your digital presence. Let Sparkable ignite your brand’s potential. sparkable.com

    Our 24×7 Jersey Shore Weather Channel: https://www.youtube.com/watch?v=dcPpb_VycOM

    Jolt your brand with the Shore’s top weather media company. Advertise today! joe@cupajoe.live