This Saturday’s game vs. Norfolk State is muuuuuuch drier than last weekend’s game. Enjoy the sunshine, but it’ll get toasty in the North End Zone. Trust me, I’ve had season tickets there for years. Go RU!
Located just 1/3rd of a mile from SHI Stadium, the St. George Greek Orthodox Church is THE place to park and tailgate for Rutgers football games! Lots of space, clean bathroom and excellent service. Reserve your space at www.rutgersparking.com.
FRIDAY’S FORECAST | It’s a Locals’ Summer September special! And, with 3 major events at the Jersey Shore this weekend, Mother Nature is celebrating with us just in time. Next week may be stormy, though. I’m thinking over the weather options.
Follow my work: www.cupajoe.live Jolt your brand, advertise with me: joe@cupajoe.live
History shows that when July is hotter than usual and August is cooler than usual, like what just happened at the Jersey Shore this year, it’s a good clue about what the coming winter might be like. Here’s why past weather patterns suggest it could be colder than average.
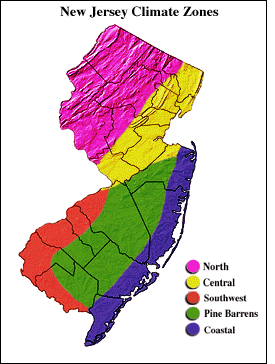
Using information from the Office of the New Jersey State Climatologist, where I did research during my senior year at Rutgers University, I collected average temperature data for every month since 1895. I focused on the Coastal Zone, which the climate office describes as areas east of the Garden State Parkway in Monmouth, Ocean and Atlantic counties, plus almost all of Cape May County.
Snowfall data came from the National Oceanic and Atmospheric Administration for Lower Township, Atlantic City International Airport, Atlantic City and Long Branch. While Atlantic City doesn’t report snowfall anymore, they did from 1874 to the 1950s, which I used for this project.
What do a hot July and a cooler August mean for the Jersey Shore’s winter temperatures?
Going back to 1895, there have been 18 years when a cooler-than-average August followed a hotter-than-average July in the Coastal Zone. That includes 2025 when August wound up 3.2 degrees below average – 31st coolest of the 130 years of record keeping. July was 2.4 degrees above average – the sixth hottest on record. The most recent such period before that was 2017.
Average here is defined as the period of record average from 1895 to 2025. Usually, though, meteorologists use a 30-year average to discuss what is above or below average. The period of record average is cooler than the most recent 30-year average due to the changing climate.
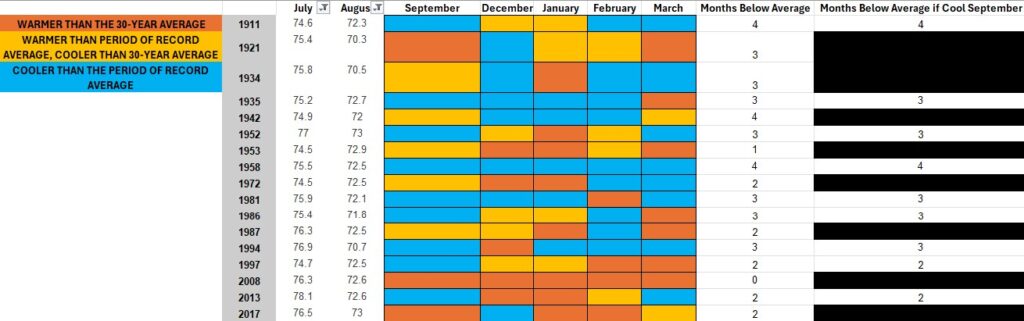
I then investigated what temperatures were for December through March for the months following those July-August stretches. There was a strong signal for temperatures to be colder than our most recent 30-year average. The 17 years broke down like this for the four-month December-March period.
Colder than average for all four months: 3 Three months colder than average: 7 Two months colder than average: 5 One or no months colder than average: 2
In other words, 59% of years had all months colder than the 1991-to-2020 average; 12% had no or only one month colder than average.
If September is chilly, too, history says a frigid winter is likely.
September is also likely to be cooler than the period of record average, given the first 10 days of the month, as well as the forecast through at least Sept. 18.
The historical likelihood that winter will be colder than average, based on just those years, is even higher. Of the 12 times this happened, 10 had at least three months between December and March that were colder than average.
The 17 years on record that had a hotter than average July and then a cooler than average August. The blue and yellow boxes indicate temperatures cooler than the 1991-2020 climate average for those months in row 1.
Hot July, cool August: Snowy winter at the Jersey Shore?
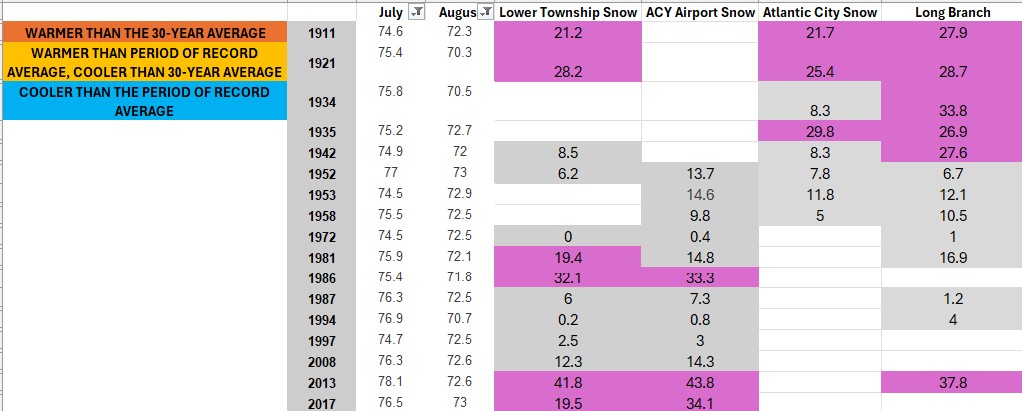
The history books don’t show a clear link between a super-hot July and a cooler-than-usual August when it comes to snowy winters. Here’s what we found about snow at four Jersey Shore weather stations after 17 winters with that kind of July and August:
Lower Township: 6 winters had more snow, 7 had less.
Atlantic City International Airport: 3 winters had more snow, 9 had less.
Atlantic City: 3 winters had more snow, 4 had less.
Long Branch: 6 winters had more snow, 4 had less.
Each weather station has been around for different amounts of time, so the number of years checked isn’t the same for all. But if you love snow, you might be excited to know that the last two times this happened (the winters of 2017-’18 and 2013-’14), there was more snow than usual. Also, if September is cooler than normal, the chances of a snowy winter go up. Out of 12 years with a hot July, cool August, and cool September, most had more snow than average.
Snowfall totals for four Jersey Shore locations in winters where the previous July was hotter than average and August cooler than average. The purples indicate a snowier than average winter. The grays indicate a less snowy than average winter.
Does history matter when it comes to this winter’s forecast?
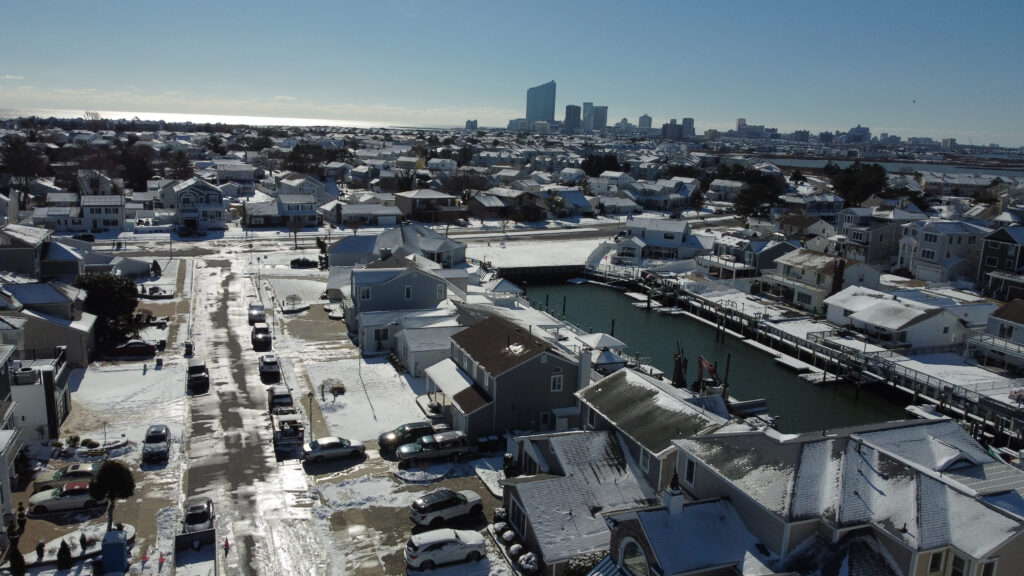
Brigantine’s local roads remained icy two days after the first inch of snow in nearly two years fell on New Jersey in January 2024. (Photo by Joe Martucci)
September is in the middle of the August-to-October time frame that long-range forecasters typically use to do their winter forecasts. As part of their research, they look at what the weather in previous springs and summers was like. They then look at what the following winter was like to give them an idea of what to expect. So if, for example, 2017 had conditions similar to 2025, they’d look at the winter of 2017-’18 to give New Jerseyans an idea of what this winter will be like.
They’re called analog years in the weather world. While each forecaster has their own winter formula, analog years are a part of the process, but usually not the main source of information they use.
I don’t do my own winter forecast. However, look for a winter forecast by the top Northeast experts in October. We can read whether they used the winter of 2017-’18 or 2013-’14 as an analog year.
9/11 at the Jersey Shore
Via the City of Absecon
In this Shore Local Weather Column, published on Sept. 11, let’s reflect on the tragic events of Sept. 11, 2001. That day brought uncertainty, pain and incredible strength to our nation. As Alan Jackson’s song asks, “Where were you when the world stopped turning?”
If you’re old enough to remember, take a moment to think back on where you were. You might also consider visiting one of the 9/11 memorials along the Jersey Shore. My favorite is in Absecon – it’s powerful, with a lifelike replica of the Twin Towers that’s both beautiful and deeply moving.
Joe Martucci, a Certified Broadcast Meteorologist and Digital Meteorologist, is the President and Director of Meteorology for Cup A Joe Weather and Drone. You can connect with him at cupajoe.sparkable.opalstacked.com/.
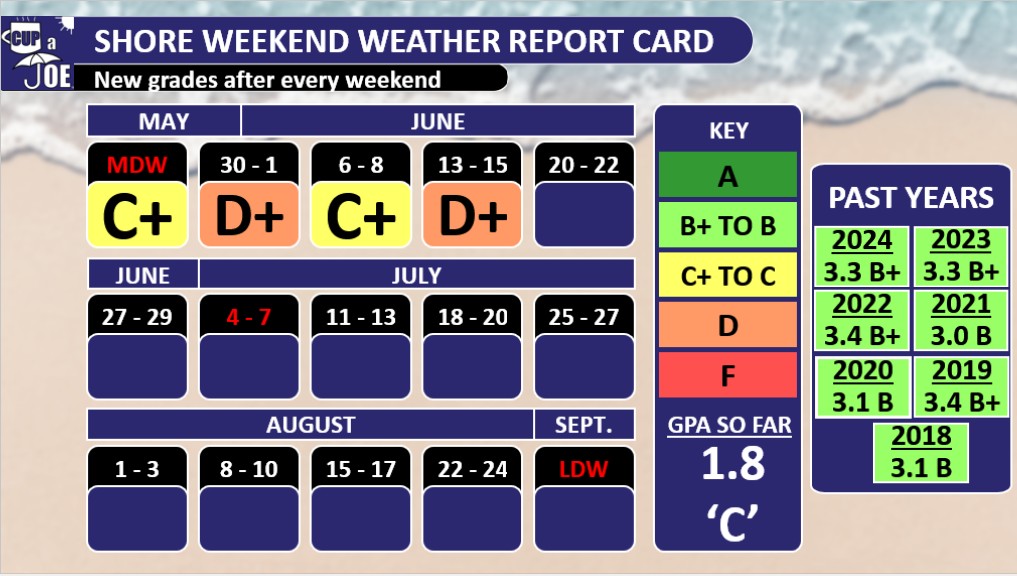
The past 11 weekends at our beach towns graded a ‘B’ or above, but it still wasn’t enough as 2025 was the lowest performing summer in the eight years of my Shore Summer Weekend Weather Report Card.
How the report card is graded
Since 2018, we’ve graded the shore summer weekends from Memorial Day to Labor Day. That’s Friday to Sunday, but also Mondays for Memorial Day and Labor Day. Fourth of July is either included in the weekend or on its own. It was July 4-7 for the 2025 edition.
I say we’ve graded because you shape the report card. You helped set the criteria for the perfect ‘A’ for your summer shore weekends.
An ‘A’ requires temperatures between 75 and 85 degrees, no rain, winds between 5 and 15 mph, low humidity and sunny to partly sunny skies. This report card covers Cape May to Sandy Hook, so if it’s 90 degrees far south, but 85 degrees everywhere else, that won’t ruin a perfect ‘A’ grade.
The 2025 report card for the Jersey Shore
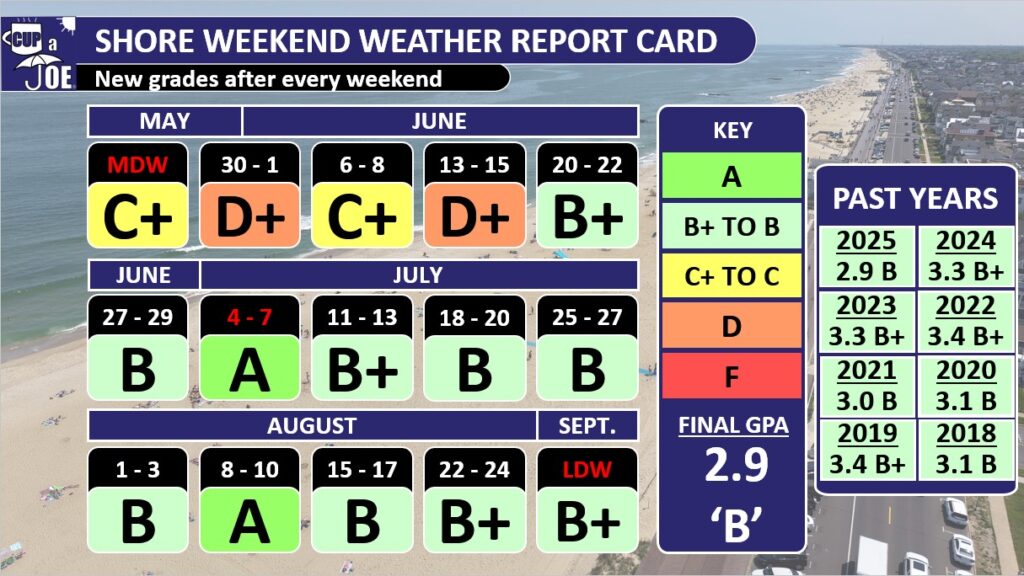
The final grade point average for the 15 summer weekends was a 2.9; good enough for a ‘B,’ but not good enough to get us out of eighth place of the eight summers I’ve graded. You have to look at the beginning of the summer to understand why.
“The reason for these gloomy, cooler weekends is part bad weather luck, and part science,” I wrote on June 19.
New Jersey sat in the middle between two air masses; the jet stream floated over the state. That brought the cool, stormy weather. Then, in a stroke of bad luck, the same pattern repeated itself every seven days, on the weekends.
The warm, bright summer weather that most of us know and love doesn’t settle in until mid-June. Poor weather weekends early in the season are common. Still, 2025 was the worst start in our eight-year history of report cards up until then. After that, the Jersey Shore studied hard to bring up its grade, but 2025 never broke out of last place.
The 11 weekends, from June 20 to Labor Day weekend, were all either a B, B+ or an A. If we just looked at those, the grade point average would be a 3.3; that’s a B+! This included a perfect ‘A’ for the Fourth of July weekend. I was away on vacation, but just talking with you and seeing the weather data, it’s fair to say it was the most comfortable Independence Day weekend in years.
We also had another ‘A’ for Aug. 8-10. Like most of August, the humidity stayed low and the amount of sunlight stayed high.
This past weekend, Labor Day, earned a B+. The only downside was it was a bit too cool, in the low 70s for highs most days. However, it was plenty sunny, not humid at all and had pleasant breezes. It’s a great sign of the Locals’ Summer September to come.
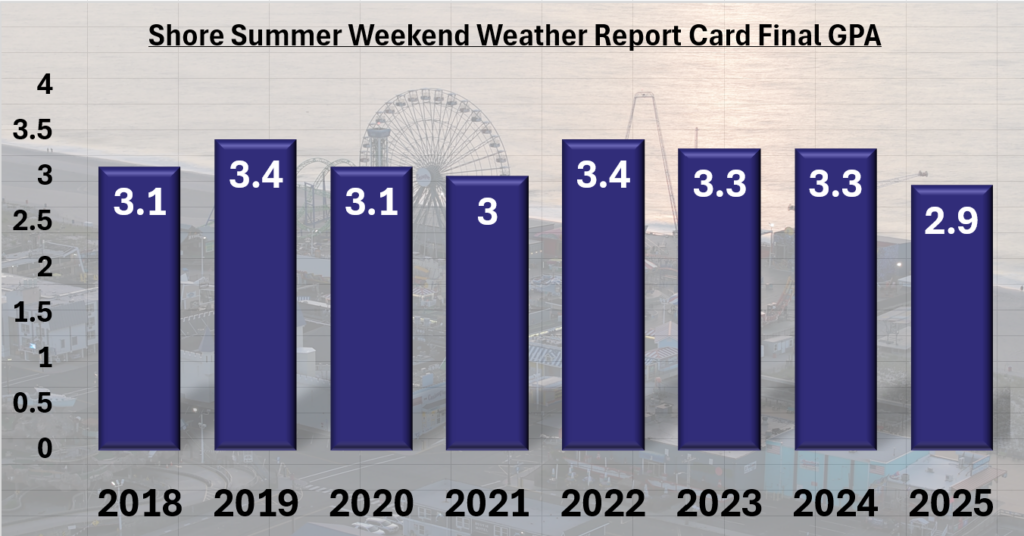
This was the lowest grade in the history of the report card. However, the 2.9 is just half a point away from the highest grade earned in the summers of 2022 and 2019. In other words, the shore never has a poor summer, climatologically speaking.
The eighth annual Shore Summer Weekend Weather Report Card
Furthermore, there was plenty of good weekend weather after Father’s Day, when summer kicks into high gear here.
Final grade point averages by year
2025 – 2.9 (B)
2024 – 3.3 (B+)
2023 – 3.3 (B+)
2022 – 3.4 (B+)
2021 – 3.0 (B)
2020 – 3.1 (B)
2019 – 3.4 (B+)
2018 – 3.1 (B)
How will September’s weather be?
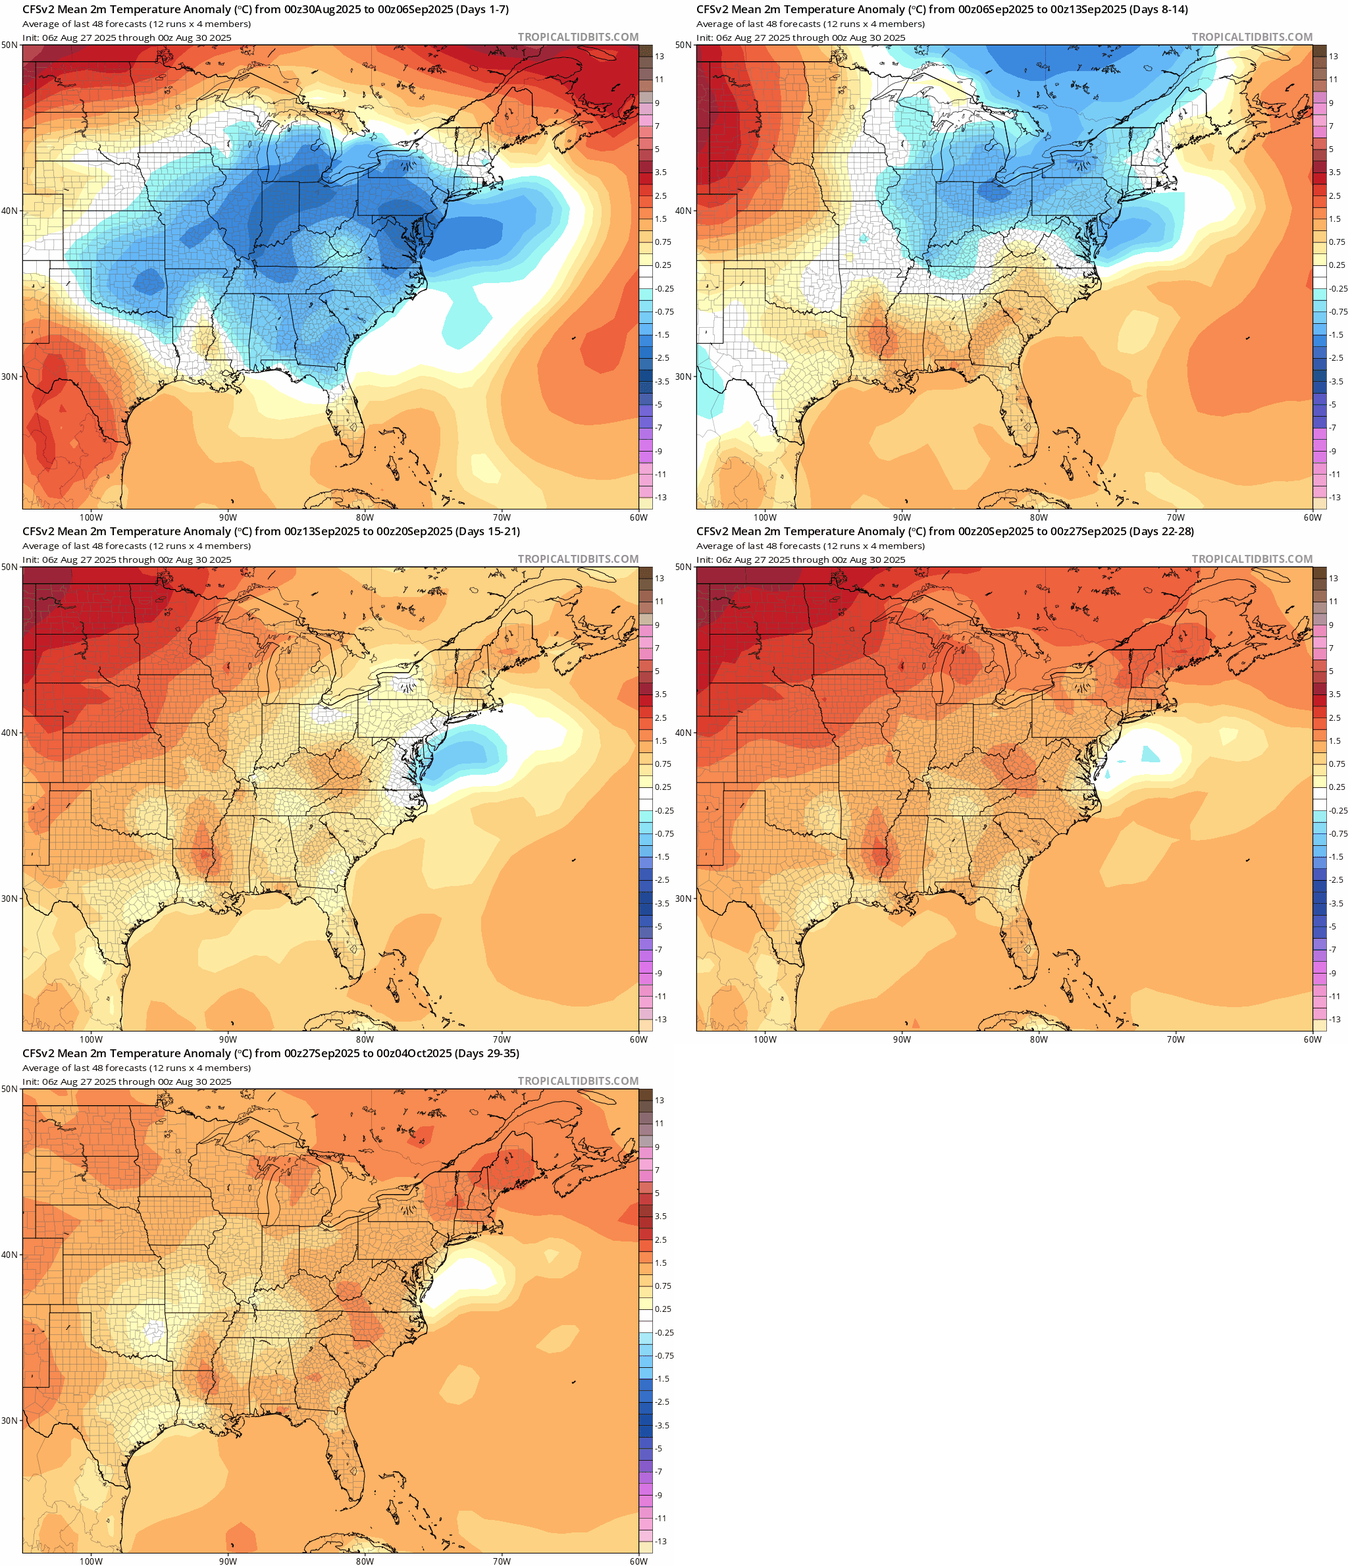
Temperatures should wind up at or just below average for the month of September. I don’t see a big change on the horizon taking us out of the generally cooler and drier weather pattern we’ve been in since the beginning of August.
The CFS forecast computer model for the month of September. The animation is for a week timeframe, seen on the upper left. The blues indicate cooler than average temperatures, which NJ is expected to see for most of September. (via TropicalTidibts.com)
High pressure should generally center itself in Pennsylvania or West Virginia. That will bring us another drier-than-average month, unless a tropical system comes through.
Then, since winds spin clockwise around high-pressure systems, our winds will generally be out of the northeast. That should keep ocean water temperatures in the 70s most of the month, but also keep our on-land high temperatures mostly in the 70s as well.
So, it will be very comfortable with plenty of good days to spend by the water for Locals’ Summer September.
We do need the rain, though. While not exactly known at the time of this writing, the beach towns should wind up with a top 10 driest August on record, according to NOAA’s Southeast Regional Climate Center. The mainland was still below average, just not as much. Farther away, Millville should be the driest August on record. Drought in New Jersey spread and worsened tremendously last September. Let’s hope that doesn’t happen again.
Thanks for following the Shore Summer Weekend Weather Report Card. I hope you enjoyed seeing the grades as much as I like posting about them in my videos and on social media. Now, happy locals summer!
Joe Martucci, a Certified Broadcast Meteorologist and Digital Meteorologist, is the President and Director of Meteorology for Cup A Joe Weather and Drone. You can connect with him at cupajoe.sparkable.opalstacked.com/.
WEDNESDAY’S FORECAST | The sunshine and comfortably mild temperatures continue for another day! Turns out, these cool mornings are making history as well for us at the shore. Enjoy the sunshine! Rounds of rain return Thursday night.
Follow my work: www.cupajoe.live Jolt your brand, advertise with me: joe@cupajoe.live
The same weather pattern has been repeating itself since beach season began on Memorial Day weekend — heat and sunshine mid-week, followed by cool, sometimes wet weekends — and it’s not a good one for our shore economy.
If you really want to get technical about it, the last time there was no measurable rain at any Jersey Shore location was May 10-11, according to data from the National Oceanic and Atmospheric Administration, and the Community Collaborative Rain, Hail & Snow Network (CoCoRaHS).
That being said, the weekend of May 17-18 only had less than a 10th of an inch of rain. Furthermore, we needed that May and early June rain because it helped crush our worst drought since 2002. Without it, the state drinking water supply would have been in serious trouble as water usage peaks about now.
My Shore Summer Weekend Weather Report Card is off to its worst start in the eight years it’s been done. Look for new updates on my social media pages after the weekend ends.
The reason for these gloomy, cooler weekends is part bad weather luck, and part science.
The science
The summer weather we think of – sunny, humid, hot inland, but cooler by the water – doesn’t really settle in until about the middle of June, which is now.
Obviously, Father’s Day weekend didn’t feel like summer weather was near. Highs struggled to reach 70 degrees, and clouds and showers were around. However, long-term weather science, what we call climatology, proves that summer weather is coming soon.
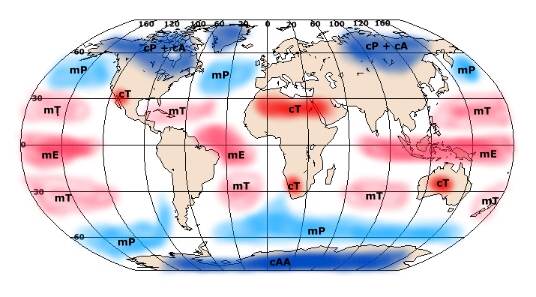
Up until this point, our weather is dominated by what’s called the Maritime Tropical Air Mass, which brings hot and humid weather pushing into the Continental Polar Air Mass – a dry, cold air mass that sits over us during the winter. The result is rain, thunderstorms and wind as New Jersey sits in the middle of these clashing weather forces. Eventually, the Maritime Tropical Air Mass wins out, but that doesn’t happen until about now, in mid-June.
Origins of airmasses across the globe. New Jersey is influenced by the cP, Continental Polar airmass from roughly October to May. However, the mT, Maritime Tropical airmass, dominates during summer. That brings the fairly consistent hot and humid weather.
That explains the potential for highs in the 60s and 70s as well as rain makers. However, it doesn’t explain why this happens on weekends. For that we look to the jet stream.
The jet stream is the river of air between 25,000 and 40,000 feet above sea level. To the north is a cooler air mass, in our case the Continental Polar Air Mass, and to the south is a warmer air mass called the Maritime Tropical Air Mass.
The jet stream is a key driver of weather patterns. Think of it as a train track for low-pressure systems. When it’s over the Mid-Atlantic you can expect wetter, or at least cloudy weather. The jet stream does not move due west to east in a straight line. There are kinks in the jet stream called Rossby Waves.
Caused by the rotation of the Earth, Rossby Waves can create troughs of lower pressure (equatorward dips) or ridges (polarward bulges) of high pressure. There are usually about five of these Rossby Waves over the Northern Hemisphere at any given time.
The speed and size of the kinks vary, but they take anywhere from five to eight days to pass through. Seven days (one week) is right in the middle of that.
The bad luck
These low-pressure Rossby Wave troughs have been moving through New Jersey on weekends since mid-May. There’s no scientific reason for it — it’s just how things have played out. To break the bad luck you need a large pattern shift. That will come soon as the Maritime Tropical Air Mass settles into New Jersey. Until it does though, expect more of the same.
To see these pattern shifts in action, go to www.xmacis.rcc-acis.org. Go to single-station, then select graphs and then temperature graph in the drop down.
After that, select 2024 as the year and annual as the period of interest.
Finally go to station selection and choose your location via ID, list or search. You can select Atlantic City, for example, by going to change CWA, select PHI from the dropdownand then choose Atlantic City Airport area from the station option.
Temperatures don’t rise evenly in the spring and drop evenly in the fall. The big jumps (like Mid-March in 2024) or downturns (like early October in 2024), show those large scale pattern shifts.
Looking ahead
There will be a pattern shift soon making our first inland heat wave of 2025 very likely. Expect sizzling temperatures starting around June 22 and lasting until about the end of the month, which would mean reaching at least 90 degrees on three or more days in a row, with overnight lows in the upper 60s and 70s, too.
As for rain, we’re moving into the time of year when large-scale storm systems don’t impact New Jersey much.
Summer weather really settles in for the next three months now.
So we’re entering the season for pop-up showers and thunderstorms which can ruin a boat or beach day, but only briefly. I expect less gloomy weather in the weeks to come.
Joe Martucci, a Certified Broadcast Meteorologist and Digital Meteorologist, is the President and Director of Meteorology for Cup A Joe Weather and Drone. You can connect with him at cupajoe.sparkable.opalstacked.com/.
It’s the annual tradition! Every weekend, from the unlocking of the beaches Memorial Day to the Labor Day that just passed us, we grade the weather at the shore.
The grading is subjective. However, after listening to you, I think it’s fair to say an ‘A’ means the weekend’s weather had:
1) A high temperature between 75 and 85 degrees.
2) No rain.
3) Anything from a partly sunny to sunny sky. We could all use a few clouds to break up the sun.
4) Low humidity.
5) A gentle breeze.
This day in Asbury Park is what a perfect A looks like (via Joe Martucci)
Since this is an average of all the days, a few hours of cloudy sky won’t ruin a perfect ‘A’.
At the same time, this is for the whole shore. A weekend where Brigantine sees pouring rain while Asbury Park is dry won’t mean an ‘F’ either.
Since this is summer, weekends start early. My report card includes Friday, Saturday and Sunday. Memorial Day and Labor Day are also included in those weekends, too. Fourth of July’s weekend is based on what day of the week it occurs.
Sunday or Monday – Counted in with the Friday before the date.
Tuesday or Wednesday – Counted as a standalone date
Thursday, Friday or Saturday – County in with the weekend or Sunday following.
Hurricane season begins on June 1. Really, in New Jersey, we like to say that there’s a 12-month hurricane season. After all, it’s the water, not the wind, that causes the most devastation, and nor’easters bring plenty of water.
This year, there are six. They range from rip currents to wind forecasts, to the change in the size of the forecast cone that you see. Here are the updates below, including how you’ll be able to see them.
Inland watches and warnings on the forecast cone map
The forecast cone is the essential part of understanding what is going on with a tropical system. The cone shows the forecasted path, along with data on location, movement, wind speed as well as watches and warnings.
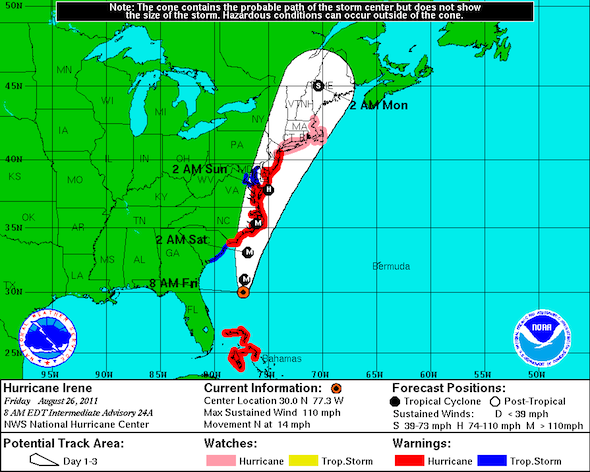
Before 2024, only the coast was outlined in the applicable watches and warnings (Tropical Storm Watch, Hurricane Warning, etc.) on the map. However, these alerts often went well inland and there was no way to see that on the map.
Current conditions and forecast cone for Hurricane Irene in 2011. New Jersey was 48 hours away from landfall, which came ashore as a weaker. tropical storm. Note that red hurricane warnings only outline the coast (National Hurricane Center).
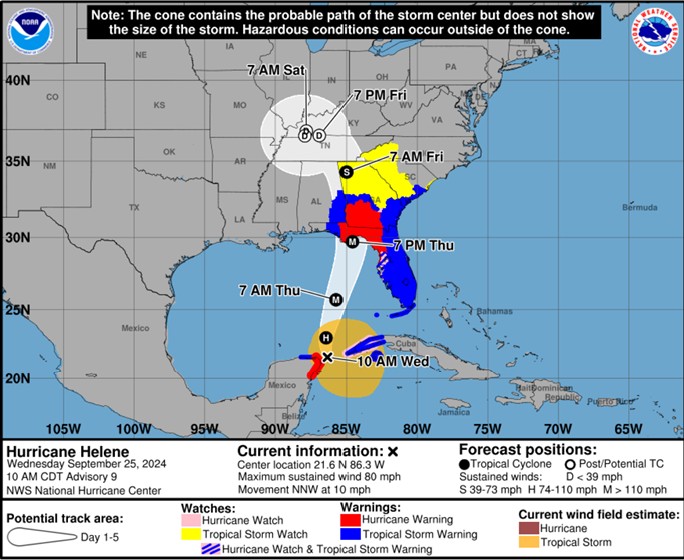
Last year, the NHC added all areas that were in watches and warnings to the map, whether they were a coastal county or not on an experimental basis. This year, they continue to keep it, but “will now contain the symbology for areas where a hurricane watch and tropical storm warning are simultaneously in effect (diagonal pink and blue lines).
Current conditions and forecast cone for Hurricane Helene in 2024. Note that red hurricane warnings extend inland to Florida and Georgia. also, there is a shaded pink and blue area in the Tampa, west coast, region of Florida (National Hurricane Center).
So, if the Jersey Shore counties were in a hurricane warning, and the inland New Jersey counties were in a tropical storm warning, all of the counties would be colored in on the map. If Atlantic County were in a hurricane watch and tropical storm warning, it would have a diagonal pink and blue line over the county. This came in handy during Hurricane Helene last September. Tropical storm watches were in effect as far inland as western North Carolina.
Before 2024, you would only know that if you lived in those counties, saw a news segment on it, or dug deep into the National Hurricane Center website. However, last year, you could see it right on the map. Of course, Helene brought catastrophic flooding to western North Carolina — $79 billion in damages were estimated to have occurred, according to the National Hurricane Center.
Rip current risks shown
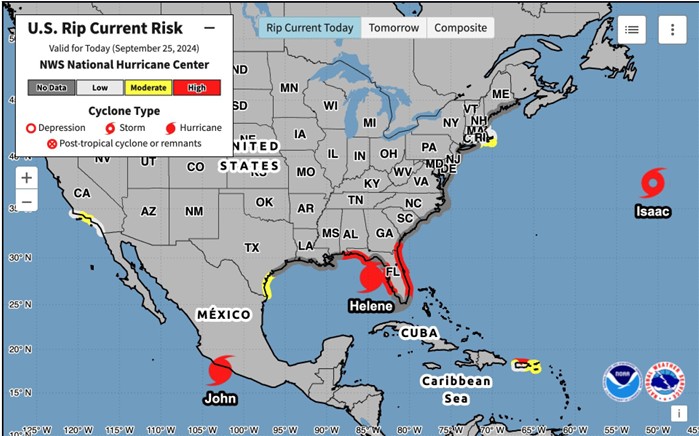
When a tropical storm or hurricane is active in the Atlantic Hurricane Basin, the National Hurricane Center will provide rip current risk information on a national map. This also includes places like Puerto Rico and Guam.
The rip current risks will be provided for the day of and the next day, along with a map showing the highest risk over the next two days. This is really for people who want a more national view of what’s happening.
Our National Weather Service local office has put out rip current and surf information for years. You can also check out my Sea and Sand video forecasts for Jersey Shore specific information. However, this is a great way to see the risks in one place.
The National Hurricane Center’s new Rip Current Risk map interface.
More lead time for undeveloped storms
June, July, October and November can bring tropical storms or even hurricanes that quickly develop and make landfall on the East Coast. Tropical Storm Fay made landfall at the Edwin B. Forsythe National Wildlife Refuge at the far southern end of Long Beach Island at around 4 p.m. on July 10, 2020. It became a tropical storm just 23 hours earlier. However, the hurricane center knew Fay would hit New Jersey as a tropical storm even before it became a tropical system.
This update is for situations like this. The National Hurricane Center can issue tropical cyclone advisory products, like forecast updates, watches and warnings, 72 hours before the storm surge or wind hit land, regardless of the storm’s status at the time. Last year, it was 48 hours. So, this is an extension of it.
Extended wind radius forecast
The category of a tropical system is based upon the maximum sustained wind speed. However, tropical storm force winds (39 mph or greater) or hurricane force winds (74 mph or greater) can extend for long stretches beyond the core of the storm.
You have to dig through the hurricane center’s website for it, but they do forecast the size of tropical cyclone wind fields in each of the storm’s four quadrants: northeast (most destructive part), southeast, southwest and northwest).
In the past, the hurricane wind radius forecasts went out 48 hours. This year, it will go out 72 hours, a testament to the improving accuracy of hurricane forecasting. To find this, search for the “Tropical Cyclone Forecast/Advisory product” when a storm is active. It’s abbreviated as TCM, too.
Forecast track cone will shrink
Most of the above updates are due to the impressive work done by the meteorologists at the National Hurricane Center. Hurricane forecasts have become better with time, allowing more useful information to be given to you, with bigger lead times.
Each year, the hurricane center updates the size of their track forecast error cone. This is based on the accuracy of the storm’s track over the past five years.
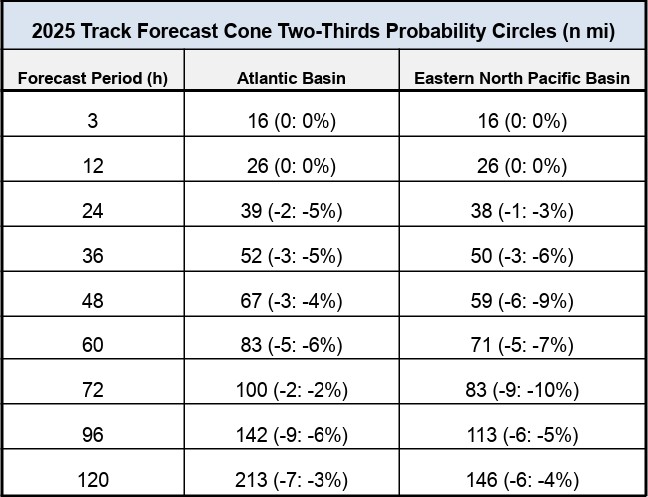
This year, the size of the cone for the Atlantic Hurricane Basin will be smaller at seven of the nine forecast periods from 3 to 120 hours out. This includes all periods 24 hours and later. The most significant will be a 6% reduction in size for the 60-hour and 96-hour forecast.
How the size of the forecast cone will change for the Atlantic and Pacific Hurricane Basins in 2025, compared to 2024 (National Hurricane Center).
As an example, a larger cone in 2024 could have Atlantic City on the edge. However, thanks to this improvement, Atlantic City could be out of the cone. That has huge implications for emergency management operations, evacuations and more.
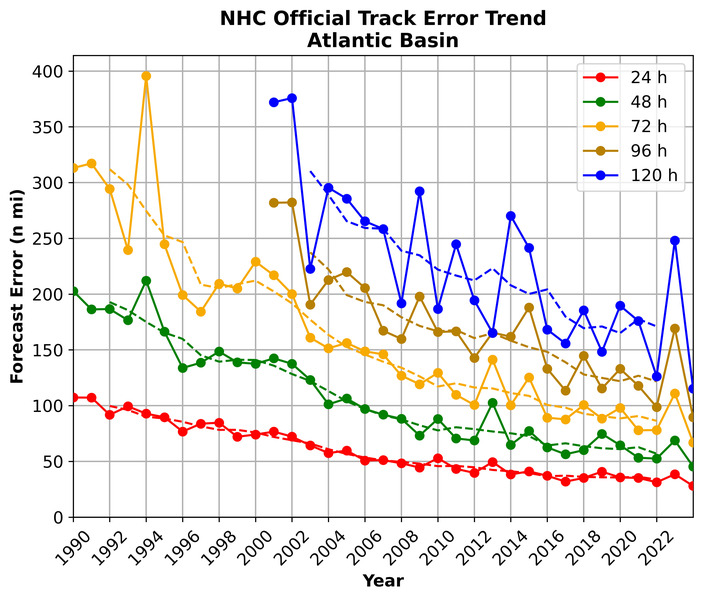
The official track error trend for Atlantic Hurricane Basin storms. Note the decrease in error since 1990 on all time scales.
Major update to Hawaii forecasts
The likelihood of a certain height of storm surge hitting a coastline is now operational in Hawaii. It’ll be initiated by the National Hurricane Center’s Storm Surge Unit and made available within 72 hours of hurricane impacts. Storm surge forecast maps began on the mainland United States in 2016.
Watch our Interview with the National Hurricane Center Director
If you go to my YouTube or Facebook pages (@JoeMartWx), catch a special interview with Michael Brennan, director of the National Hurricane Center. It’s all part of the Tidal Flooding Talk show I co-host with Dan Skeldon (a familiar name to many), and Palma Shiles as part of the New Jersey Coastal Coalition. When you have 30 minutes, give it a watch or listen.
The old adage goes that in New Jersey, once you get to Mother’s Day you can start planting your gardens. That holds merit. Mother’s Day in the United States is celebrated between May 8 and May 11 (May 11 this year), on the second Sunday in May.
At Atlantic City International Airport in Egg Harbor Township, there’s an 11% chance that low temperatures will be at or below freezing on or after May 8, according to the National Oceanic and Atmospheric Administration (NOAA). Go to May 14, and that’s happened just twice in the 80-year history of weather records at the airport.
Cross the bridges to the beaches and your risk of a freeze goes away completely. The latest freeze on record at Sen. Frank S. Farley State Marina in Atlantic City, is April 30. That was back in 1874, the first year of record keeping in the then-young city. Note that the northern Jersey Shore has had freezes as late as May 11. However, there’s only a 7% chance of a May freeze.
You don’t need to rely on the old adage for your planting advice this season. Your friendly, neighborhood, Shore Local meteorologist can help you with the question of whether or not it’s time to plant this spring.
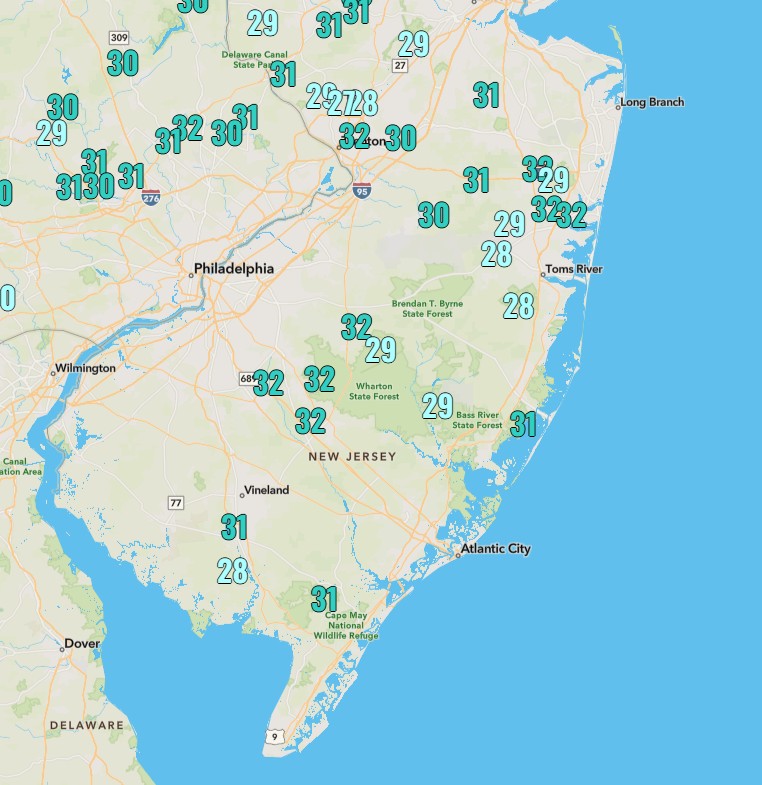
Low temperatures on April 18, 2025, the last inland freeze of the spring, so far. (Image via the National Weather Service)
When was our final freeze of the season?
Was April 18 the last freeze in the inland parts of the Jersey Shore in the 2025 season? Woodbine (Cape May County), Tuckahoe (Cape May County), as well as parts of Ocean and Monmouth counties dipped below 32 degrees. While Atlantic County did not report a freeze, there was localized patchy frost, which harms young plants as well. At the immediate coast, the last widespread freeze was back on April 9.
It’s differences like this that we take for granted as residents of the Jersey Shore. Most places in the United States don’t have these kinds of microclimates.
What is the forecast for the rest of April?
It’s much more likely that we will go the rest of the month without a killing freeze. The Climate Prediction Center, part of NOAA, was forecasting “likely” above average temperatures for April 26 to May 2 in their April 18 update. With average low temperatures in the mid-40s inland, and near 50 at the coast, you have a better chance of putting your ceiling fan on at night than a killing freeze. I can’t completely rule out frost in the rural Pine Barrens, but this is unlikely.
How about May?
The shore will be frost and freeze free. By May 1, we would need a historic polar plunge of cold air. Remember, too, that Atlantic City has never had a freeze past April 30.
For the inland part of the shore counties, 16% of Mays had a low temperature below 32 degrees. The most recent was May 11, 2010.
The general weather pattern for the Northeast in the first half of May is a thicker-than-usual atmosphere overhead. The thicker the atmosphere, the more potential for warmer air in the ground.
Of course, the cold ocean can kick in a chilly daytime sea breeze. However, sea breezes also moderate the overnight low temperature to the warmer side. So the risk of a freeze is low.
By the second half of May, freezes or frosts in this part of the state are unheard of. After May 15, you’d need a historic cold plunge to get one, and I just don’t see that happening.
You can plant with confidence now
Hidden Creek Farm in Stow Creek, Cumberland County, NJ
If you’re at the beaches, you can start planting if you haven’t already. It’s not unusual to begin planting at this time.
For inland locations, like Somers Point or Egg Harbor Township, I say go for it and let the fruits and vegetables grow. Farmers planted their asparagus and spinach weeks ago, and they’ll start harvesting in early May.
When I was growing up in Union County, we used to go to my Nonna’s (grandma in Italian) house to plant corn, plenty of tomatoes and carrots. It was one of my favorite days of the year. Each year, they would let my sister and me plant a fruit or vegetable of our choice. We tried growing watermelons with little success, and sunflowers with better success.
The plot was about 10 feet by 10 feet, but it felt like a jungle as a kid during the late summer and autumn, with stalks taller than me all around.
She is still with us, but we decommissioned the garden years ago. However, the memories last forever. I hope you have some of the same this season.
Joe Martucci, a Certified Broadcast Meteorologist and Digital Meteorologist, is the President and Director of Meteorology for Cup A Joe Weather and Drone. You can connect with him at cupajoe.sparkable.opalstacked.com/.
View the original article on Shore Local News on April 17 here.
You may have seen a number of articles come out in the first week of April with headlines like:
“Rising Sea Levels Will Threaten 323K+ In NJ By 2050, New Study Says: See The Map”
“Severe coastal flooding could threaten Wildwood, Ocean City, and A.C. by 2050, report says”
“New Study Projects Climate-Driven Flooding for Thousands of New Jersey Homes”
What do they actually mean? Why such a flurry of articles from reputable news sources? They sound kind of scary.
They all come from the release of Climate Central’sCoastal Risk Finder tool on March 31. Climate Central is a nonprofit organization based in Princeton, Mercer County, whose mission is to “address climate science, sea level rise, extreme weather and energy topics.”
I was fortunate enough to be asked by Climate Central to be a panelist for the public release of the product that Monday. More than 120 journalists and media meteorologists attended the virtual meeting to learn about the tool which forecasts future flooding and its socioeconomic impacts.
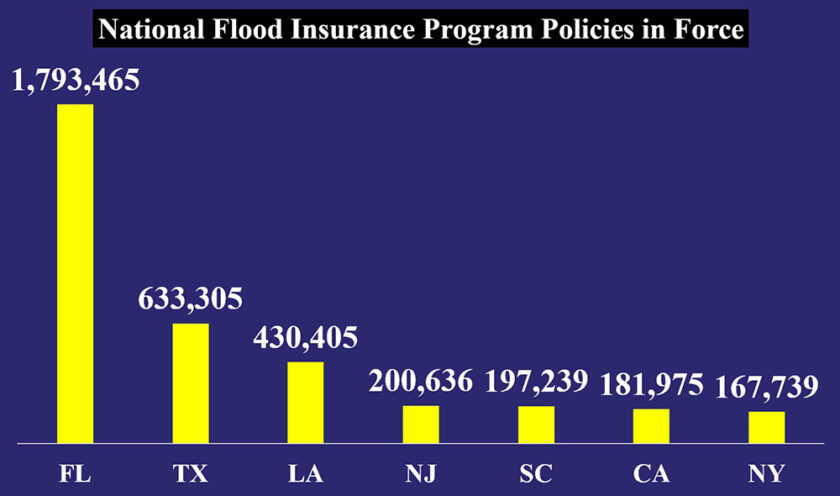
National Flood Insurance Program Policies In Force.
As of March, there are 200,636 flood insurance policies in force by the National Flood Insurance Program in New Jersey. That’s the fourth highest of the 50 states, ranking just above South Carolina. Furthermore, those policies cover over $50 billion worth of New Jersey property.
Below is a summary of what the Coastal Risk Finder shows for the present and future of the Jersey Shore, as well as how to use the tool. All of the data is based on an intermediate sea level rise scenario. This scenario lines up best with the options presented by Climate Central, in comparison with what has happened historically in Atlantic City, our primary Jersey Shore tidal location.
Interagency data from 2022 is the source for sea level rise projections used. Population is based on 2020 levels. To get the most out of the new tool, be sure to use a desktop or laptop computer.
Not much change in flooding impacts by 2030
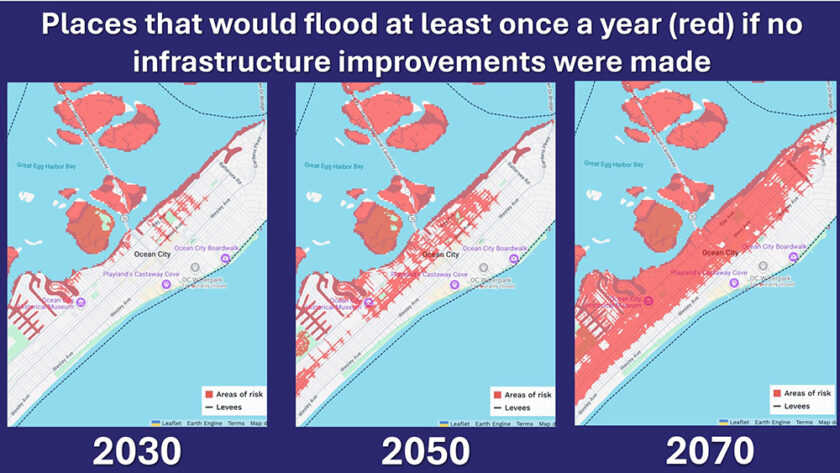
According to the risk finder, 7.9% of people in Cape May County, and 1.9% of people in Atlantic City are at risk of water inundation in their homes at least once in 2030. That’s roughly what it is now. In other words, a flood 2.7 to 2.8 feet above mean higher high water (MHHW) floods the area at least once a year. MHHW is the average height of the two high tides seen per day.
By 2050, those impacts double in size
By 2050, according to the risk finder, 14% of people in Cape May County, and 4.8% people in Atlantic County are at risk from either sea level rise or a flood that happens once a year, on average.
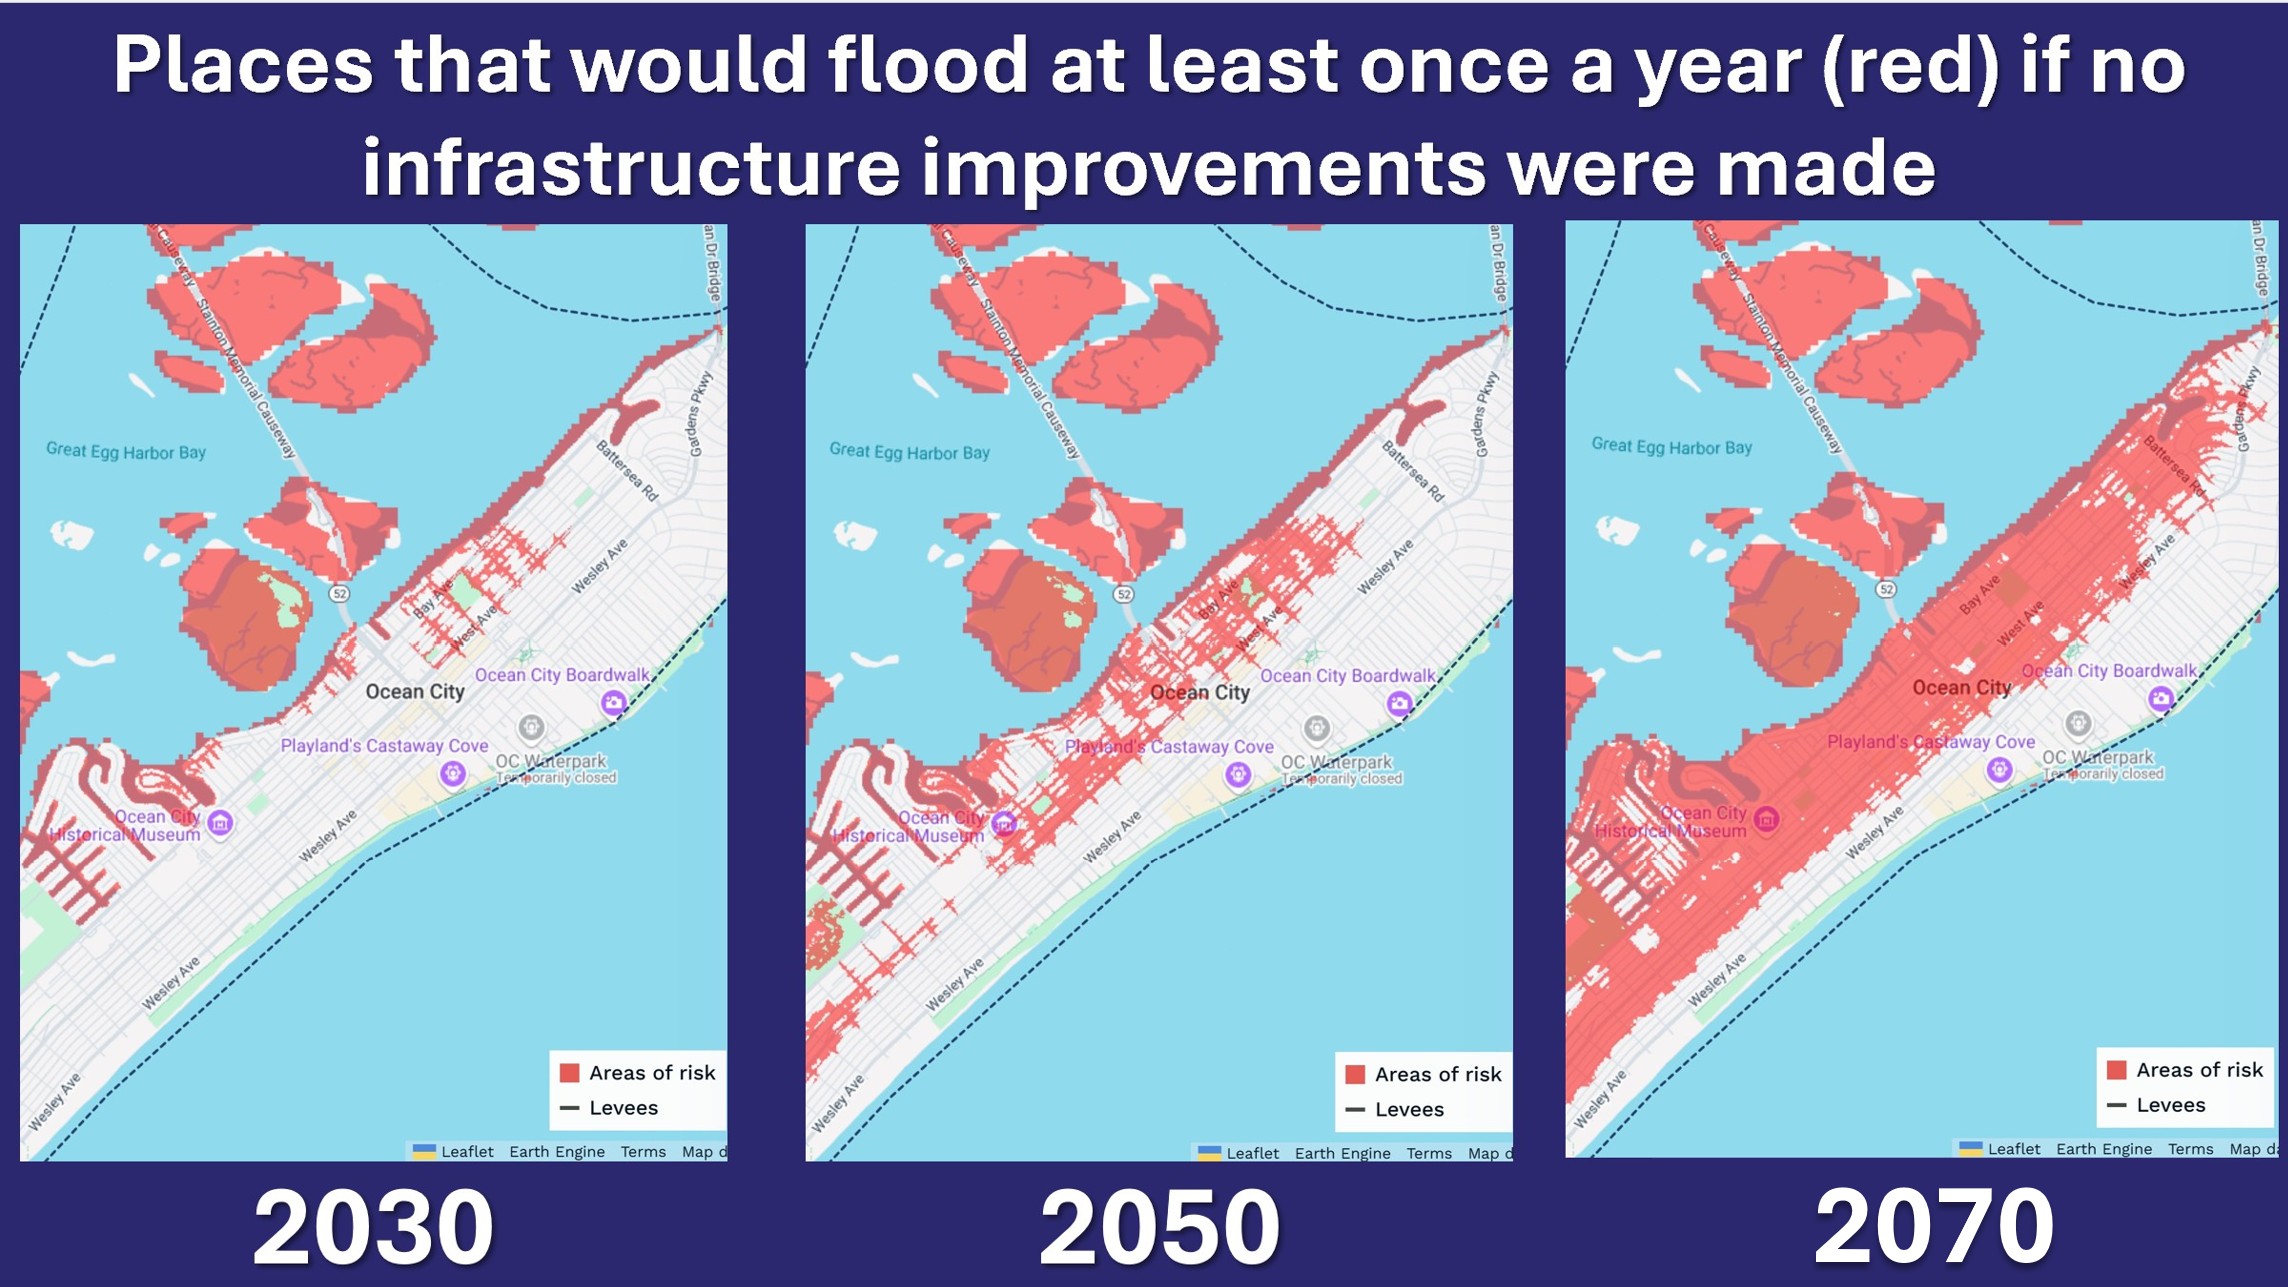
This indicates a flood 3.2 to 3.4 feet above mean higher high water in Ocean City, which would involve most areas bayward of West Avenue, from Second Street to 18th Street. Compare that to 2030, where only areas bayward of West Avenue, from Third Street to Eighth Street, would be underwater.
Places that would flood once a year.
Our kids and grandkids could be at serious risk
Lastly, we’ll look at 2100. While most of us probably won’t be alive (I would be 109 then), our kids and especially grandkids would be around. That projects a vastly higher number.
According to the risk finder, 35% of people in Cape May County, and 16% in Atlantic County would flood at least once a year. When considering just the shore towns, that number jumps to at least 65% of Ocean City and the Downbeach towns would flood during a flood that’s 5.2 to 6.1 feet above MHHW.
Using Ocean City again, nearly everywhere bayward of Central Avenue would experience floodwater at least once a year. That’s nearly all of the island. Most of the Ocean City Municipal Airport would be included in that, too.
What else to consider
Your town’s emergency managers, elected officials and administrators take pride in protecting your property from floodwaters. The New Jersey Coastal Coalition, for which I do work, brings communities up and down the Jersey Shore together to share common sense flooding solutions. The result has been a reduction in your flood insurance premiums.
Ocean City is eligible for a 30% rate reduction this year. Longport, Linwood, Margate and Ventnor have all earned 25% off. Somers Point has earned 20% off.
The data and projections shown on the Coastal Risk Finder do not take into account future actions your town will take to increase their CRS score. It also doesn’t consider other actions being considered by towns and the state such the NJ Resilient Environments and Landscapes program.
How to navigate the Coastal Risk Finder
First go to www.climatecentral.org. Then go to Tools and select “Coastal Risk Finder” from the dropdown.
On the left-hand side, you’ll be able to select your town, county or state. You can then select your scenario. You can view the risk by year, good for viewing what sea level rise projections will bring. Or you can view the risk by water level, which you could use to see how another Superstorm Sandy (search for 4 or 5 feet) would flood somewhere now.
If you select the risk by year, you then go to additional settings to find your scenario.
For purposes of this article, I used the sea level rise + annual flood under “projection type.” Then, for “sea level protection source” I used U.S. Interagency 2022.” Then I clicked on the “intermediate” sea level scenario.
Joe Martucci, a Certified Broadcast Meteorologist and Digital Meteorologist, is the President and Director of Meteorology for Cup A Joe Weather and Drone. You can connect with him at cupajoe.sparkable.opalstacked.com/.

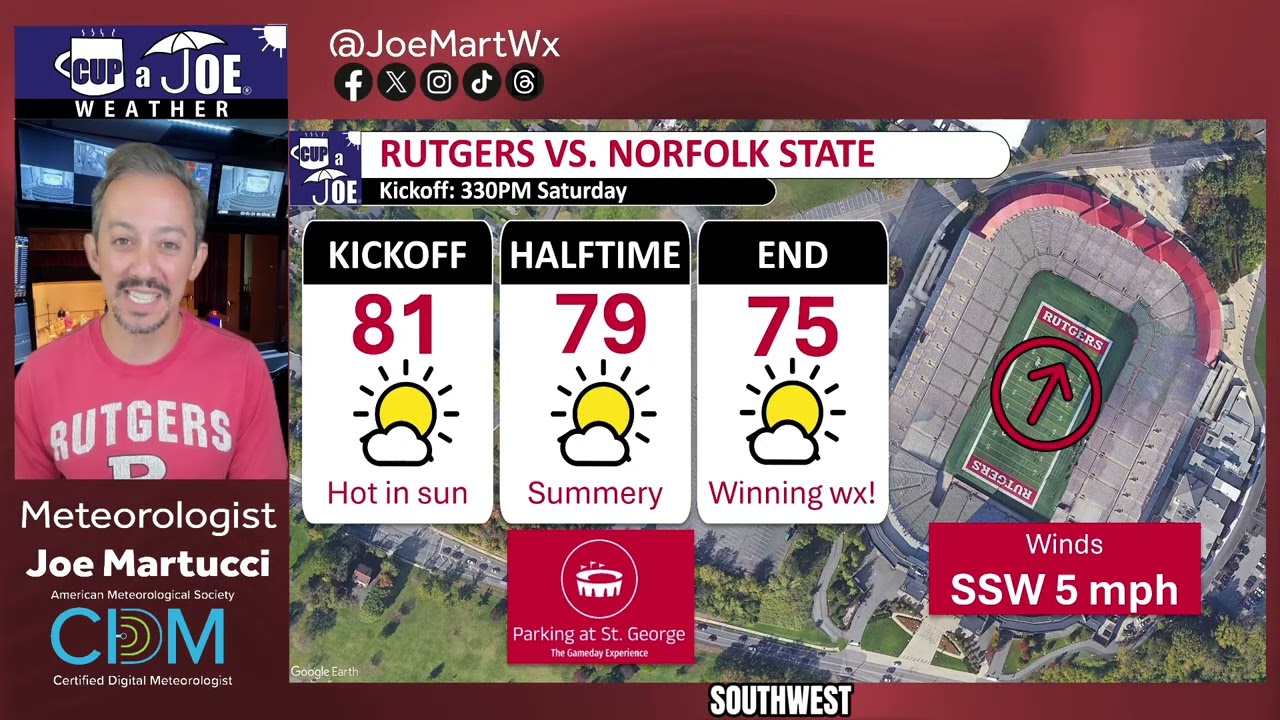
 This Saturday’s game vs. Norfolk State is muuuuuuch drier than last weekend’s game. Enjoy the sunshine, but it’ll get toasty in the North End Zone. Trust me, I’ve had season tickets there for years. Go RU!