Tag: Jersey Shore

  • The incredible proof that the Cape May Bubble really exists!

    The incredible proof that the Cape May Bubble really exists!

    This column initially appeared in Shore Local Magazine on August 7th

    It’s a story that is told often in Cape May County.

    You’re out by the water and you see storm clouds to the west. Your weather app on your phone flashes in bright oranges and reds, showing the heavy rain. It’s moving toward Ocean City, or Reeds Beach or Cape May Point.

    But as the minutes go by the storm never comes. The radar turns light green, or maybe blank as the rain disappears.

    That’s the Cape May Bubble at work, and there’s hard, scientific evidence that it’s a real phenomenon in the area. Compared to the rest of the state, the temperatures, and the number of thunderstorms and snow storms, are simply different here.

    Cape May County geography matters
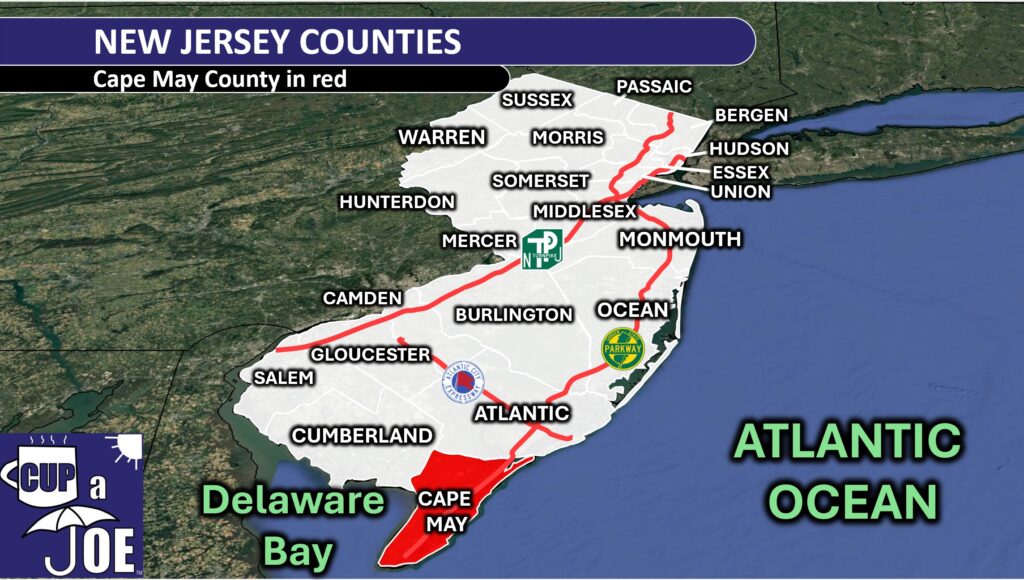
    Map of New Jersey with Cape May County highlighted.

    Cape May County is on a peninsula, surrounded by water on all three sides (Delaware Bay to the west, Atlantic Ocean to the south and east). Yes, New Jersey is also technically a peninsula, but the vast bodies of water around our southernmost county drive much of the weather we see.

    Water warms and cools more slowly here. For the county, this means that towns stay cooler than most of New Jersey during the spring and summer. The extra water acts like extra air conditioning. Meanwhile, during the fall and winter, the county is milder than the rest of the state. County business leaders know this and over the years built tourism marketing campaigns based on it.

    Fall for the Jersey Cape” is one such slogan used in years past, promoting beach days into October, and plenty of comfortable days to explore the rest of the Jersey Cape. The result helped put Cape May County in second out of New Jersey’s 21 counties for tourism spending from 2021 to 2024, with $8.1 billion spent in 2024, according to the Cape May County Tourism office.
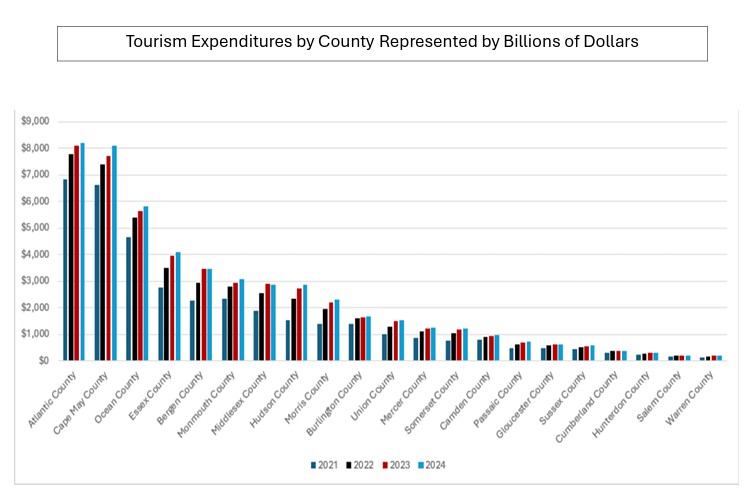
    Data via Cape May County Government

    Between October and March, Cape May’s average temperatures are about 1 degree higher than Atlantic City International Airport in Egg Harbor Township, according to the National Oceanic and Atmospheric Administration. Data shows that Cape May air temperatures stay warmer through May, like the water on the peninsula’s three sides.

    By June and July, temperatures in both places level out. In fact, Cape May has cooler high temperatures from around Memorial Day weekend until early August.

    Cape May County has fewer thunderstorms

    The Cape May Bubble phenomenon I hear about most often is fewer thunderstorms. Turns out, that’s true. Most of New Jersey experiences roughly six hours of heavy rain falling overhead between May and August — peak storm season.

    The one exception? The Cape-May-to-Vineland corridor. Only four hours of that type of rain falls here, on average, according to research led by Frédéric Fabry, director of radar observation at McGill University in Canada.
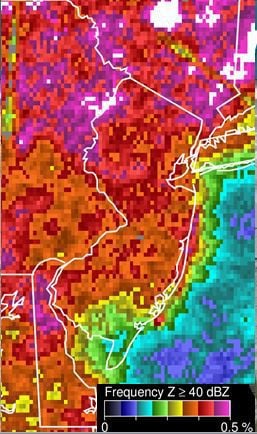
    Frequency of radar detecting rain heavy enough to be classified as a thunderstorm during the research period by Fabry et. al. Notice the lower percentages in far southeastern New Jersey than the rest of the state (Via Bulletin of the American Meteorological Society).

    If storms pass west to east, as they typically do, the relatively cooler Delaware Bay during these months stabilizes the storms, weakening them to below the thunderstorm threshold used in the Fabry’s study. Not only are there fewer thunderstorms, but they occur later in the day, on average.

    Cape May County, along with Atlantic and southern Ocean counties, has a preferred thunderstorm time of 6 to 8 p.m. The rest of the state is between 4 and 6 p.m.
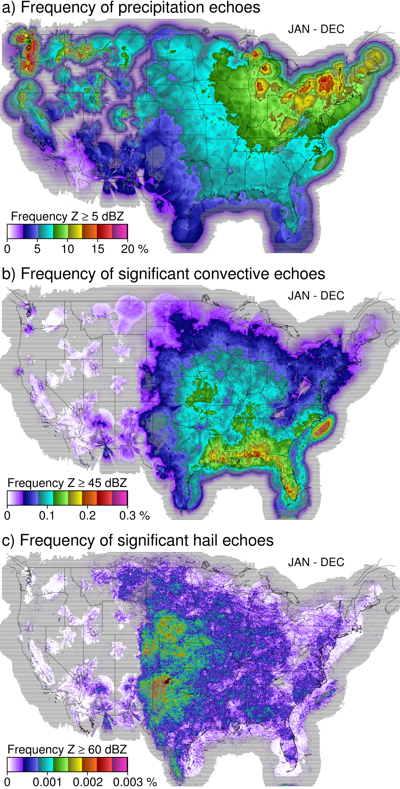
    Fabry and his team took all radar scans across the Lower 48 of the United States to detect how many precipitation (A), thunderstorm-heavy rain (B) and hail (C) occurred over any given location. Echoes refer to the intensity of the radar beam that bounces off the precipitation and returns to the radar site. In New Jersey, that is either the radar site at Fort Dix, NJ or Dover Air Force Base, DE. (Image via the Bulletin of the American Meteorological Society)

    Thunderstorms can happen any time of the day, but fewer and generally later thunderstorms lead to more time outside. That means a healthier South Jersey Shore economy.

    There is no scientifically proven reason for this. However, conversations with Fabry and Dave Robinson, the New Jersey State climatologist, in years past suggest that the near daily seabreeze influences the later timing.

    The shape of the coastline runs southwest to northeast from Cape May to Long Beach Island. It’s then positioned south to north from Island Beach State Park to Sandy Hook. Furthermore, Cape May County is just more southeast. Storms begin many times during the day on the east side of the Appalachian Mountains. By the time they get to Sea Isle City, it’s later than the time they got to Philadelphia.

    Cape May County has less rain

    The southern (or lower) part of Cape May County is also among the driest in the state. Here’s a look at the average annual precipitation for our major weather reporting stations.

    • Lower Township, Cape May County: 43.84 inches
    • Atlantic City, Atlantic County: 43.62 inches
    • Egg Harbor Township, Atlantic County: 45.96 inches
    • Long Branch, Monmouth County: 52.53 inches
    • Trenton, Mercer County: 45.63 inches
    • Newark, Essex County: 46.60 inches
    • Belvidere, Warren County: 48.21 inches
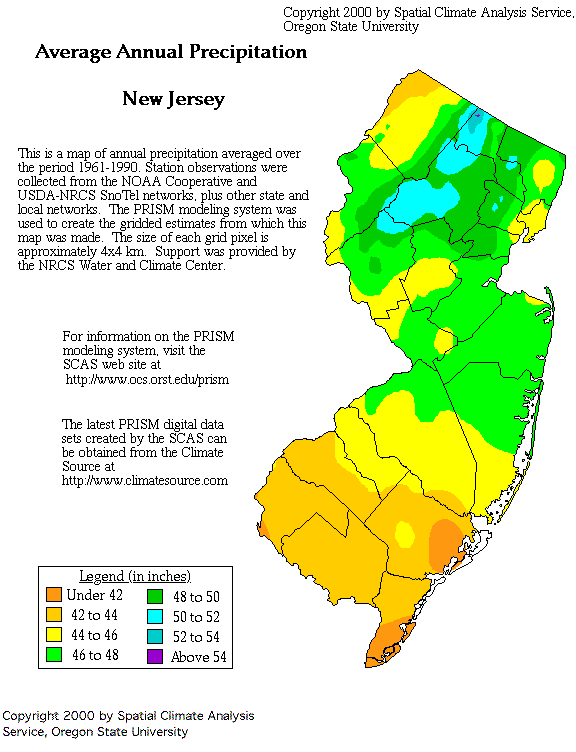
    Average annual precipitation in New Jersey in the year 2000. While the annual precipitation is slightly different in 2025, Cape May County still remains the driest place in the state on any given year (Via Oregon State University).

    The reason, in part, for the drier weather is the water being on three sides.

    Seabreeze fronts are common here from March to August. Once the seabreeze front passes from the coastline, inland, the air is more stable. That means it’s less likely to rain.

    Furthermore, Cape May County is the county farthest removed from the process known as upsloping, which brings rain to the foothills of mountains. In this case, that’s the Appalachian Mountains.

    Cape May County has less snow

    Cape May County is the state’s flattest and southernmost county. Therefore, having the least amount of snow just comes with the territory. The long-standing Cooperative Observer Station in Lower Township averages 14.8 inches of snow in a year.

    From December to March, snow season, the water temperature in Cape May Harbor is between 39 and 45 degrees, according to the National Oceanic and Atmospheric Administration. Nor’easters, and the northeast winds they bring, funnel this above-freezing ocean air into the county. How many times has Trenton or Hammonton been covered in 6 inches of snow, while Marmora or Ocean City barely has a flake? The relatively mild water is the reason.

    Are there other bubbles in New Jersey?

    Given the data, you can make the case that the Cape May Bubble is really an Atlantic City Bubble, a Somers Point Bubble and a Millville Bubble. This far southeastern corner of New Jersey experiences different weather than the rest of the state.

    I had the opportunity to meet Fabry at the American Meteorological Society conference in Baltimore in January 2024. He still remembers when we first talked about the phenomenon in 2019. He was kind and laughed when I explained just how much people talk about the bubble down here.

    The man who proved the Cape May Bubble is real, Frederic Fabry, along with myself at the 2024 American Meteorological Society Annual Meeting in Baltimore, MD.

    Given Quebec’s deep-rooted history with tourism in Cape May County, it might be time we welcome him for a visit. Expect the storms to stay away if he comes.

    Joe Martucci, a Certified Broadcast Meteorologist and Digital Meteorologist, is the President and Director of Meteorology for Cup A Joe Weather and Drone. You can connect with him at cupajoe.sparkable.opalstacked.com/.

  • ‘They were heroes.’ Avalon Beach Patrol rescues 10 as sailboat sinks

    ‘They were heroes.’ Avalon Beach Patrol rescues 10 as sailboat sinks

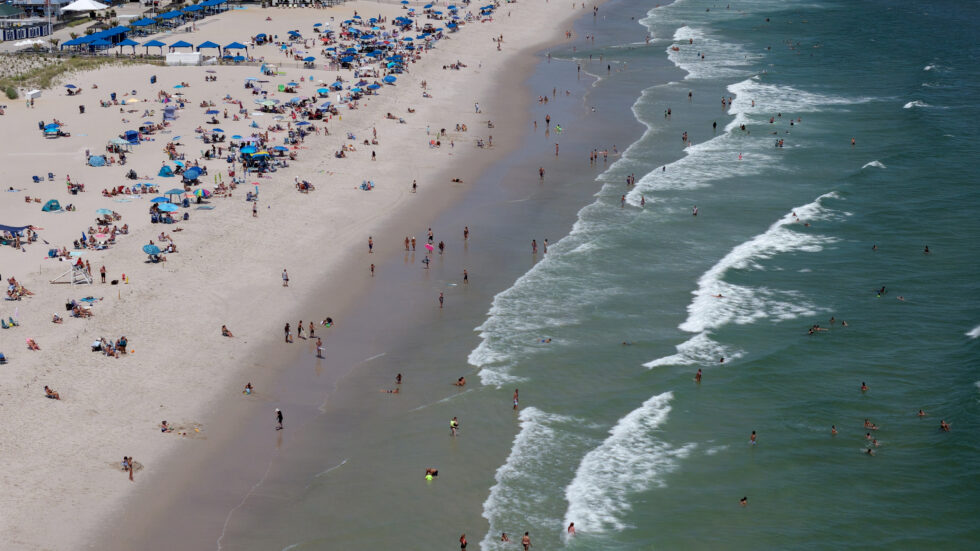
    News 12 did an excellent job covering the dramatic rescue of 10 people as a sailboat sank off of Avalon on July 25. Tom Kronsowski had me on to discuss the water and weather conditions that led to the rescue.

    WATCH HERE: https://newjersey.news12.com/they-were-heroes-avalon-beach-patrol-rescues-10-as-sailboat-sinks

  • NJ ocean’s warm – the direct opposite of last summer

    NJ ocean’s warm – the direct opposite of last summer

    This article initially appeared in Shore Local magazine on July 31

    Despite some stormy and cool weekends this summer, there’s one thing we can say about the Jersey Shore right now: “Come on in; the water’s warm!”

    The ocean water has been above average for most of the summer so far. According to the National Oceanic and Atmospheric Administration, 75-degree water temperatures were recorded off the Steel Pier in Atlantic City on July 5, 6, 8, 12-17, and 23-28. In other words, over half of the July days, the ocean water temperature was warm. That’s more like South Carolina than South Jersey.

    It’s the complete opposite of last summer. June and July had zero days with a water temperature above 75 degrees. In fact, 11 July days were in the very chilly 50s, and 55 degrees was the 8 a.m. water temperature on July 18, 2024. Getting in the ocean was tough.

    To explain why summer 2025 has been an absolute warm ocean lover’s delight, I’ll use another mantra: “Life’s at ease with an ocean breeze.”

    Wind direction determines ocean water temperature

    Ranking behind the strength of the warming sun and the currents, the direction of the wind plays the biggest role in water temperatures in New Jersey. In fact, it’s the main player for the day-to-day, or hour-to-hour variations.

    Cooler ocean waters are caused by upwelling. Upwelling describes what happens when the typically warmer sea surface water moves away from the coast and out to sea. Colder water from the sea floor then rises to the top along the shoreline.

    This is a critical part of our marine ecosystem. That cold water is nutrient-rich and keeps our living ocean alive.

    Upwelling is caused by Ekman Spiraling, according to the American Meteorological Society’s glossary.

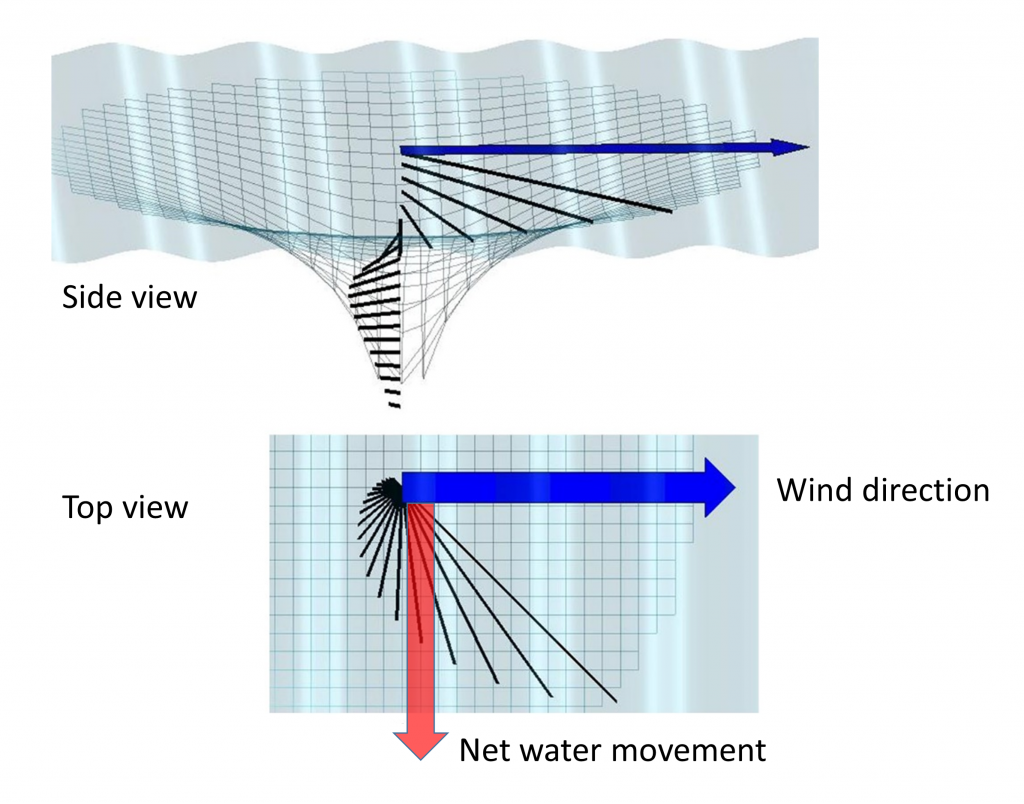
    A look at how Ekman spiral works. Notice the lower image. The water will move to the right of the direction of the wind. In New Jersey, that means a south wind will push the warmer, near surface ocean water away.

    I’ll save the meteorology for you, but for the Jersey Shore, and the Northern Hemisphere, upwelling occurs any time the coastline is to the left of the direction of the wind. In our case it means a wind from the southwest or south. The Jersey Shore is to the left of the air current. That causes Ekman Spiraling, which pushes that warm water away.

    On the other hand, warmer water gets pushed onshore with onshore winds. A wind from the southeast, east or even northeast will blow warmer-than-usual water in from the Gulf Stream our way.

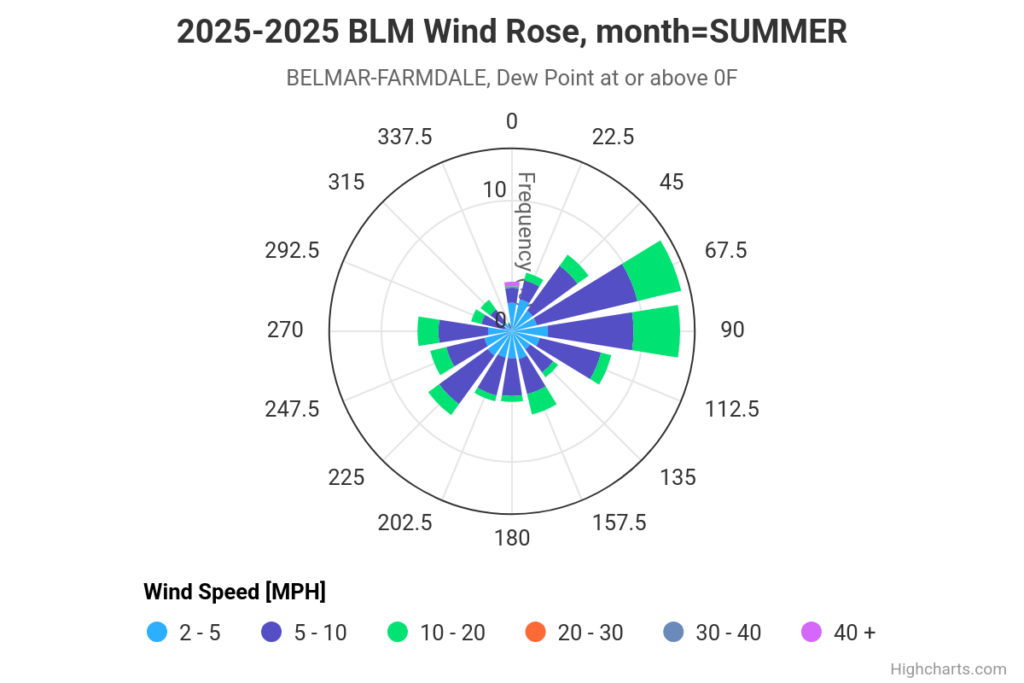
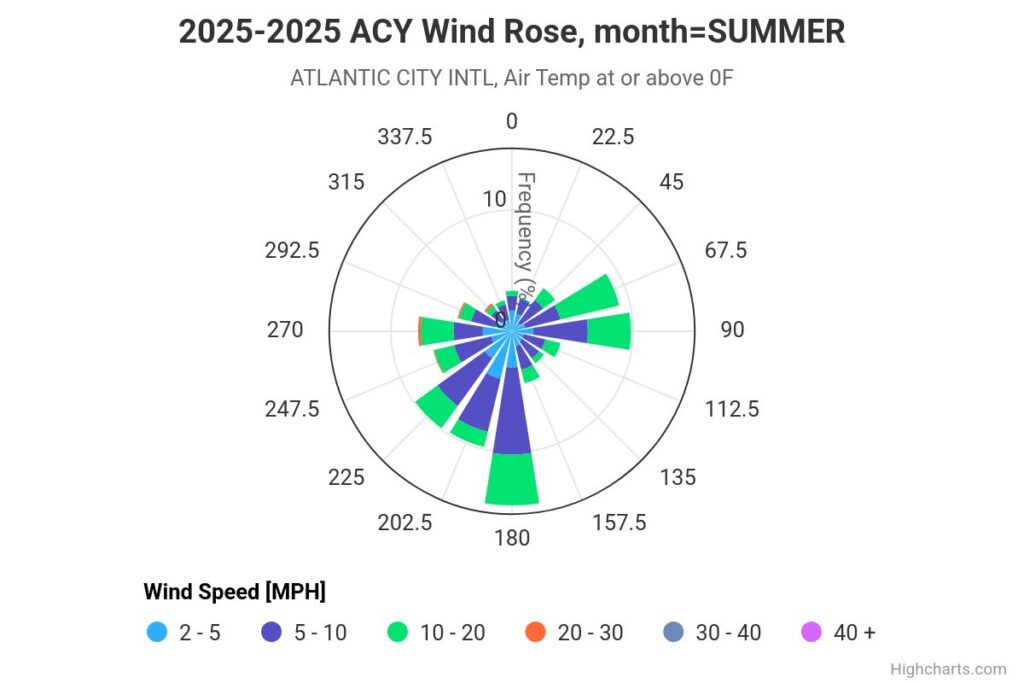
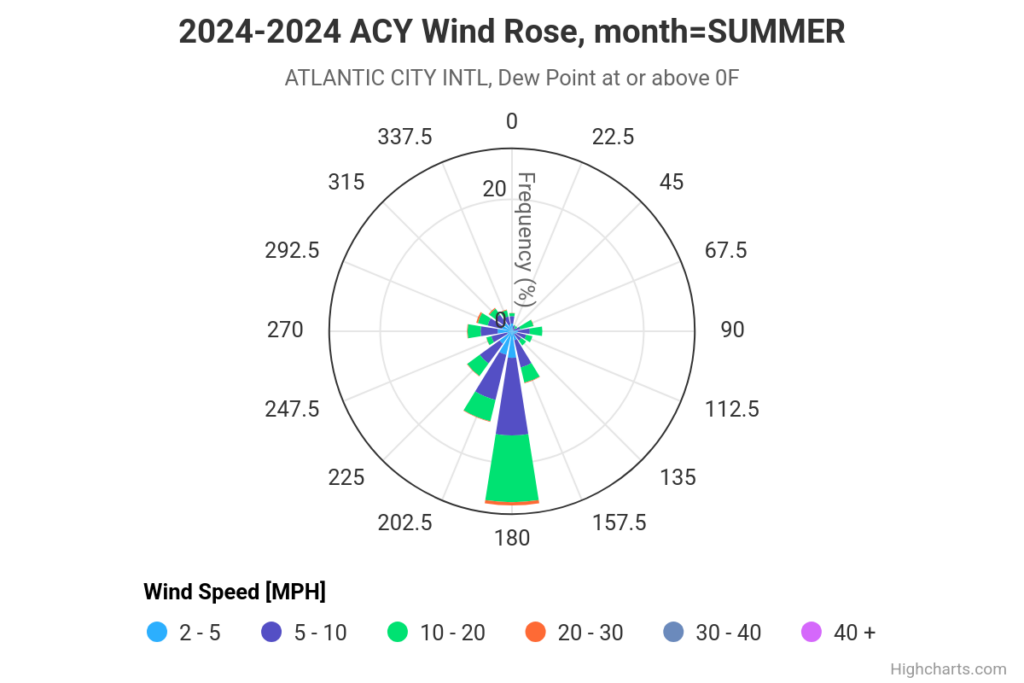
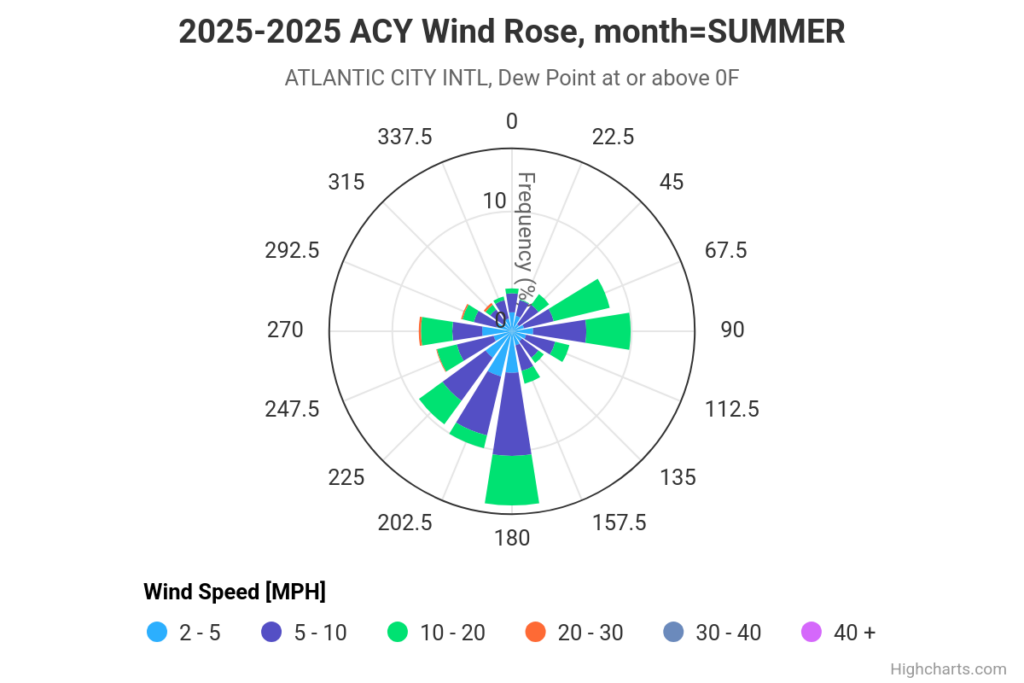
    From the time climatological summer began on June 1, to July 28, winds were out of the favorable southeast, east and northeast direction 30% of the time at Atlantic City International Airport in Egg Harbor Township, according to the Iowa Environmental Mesonet. Yes, the airport is inland, but the large-scale wind measurement known as synoptic wind direction, is usually the same between the airport and the coast itself.

    During summer of 2024, winds blew from the southeast, east to northeast just 12% of the time. During the summer of 2025, it has been above the long-term average of roughly 20%.

    Go up the coast and you have had the same results only more often. Readings at Monmouth County Executive Airport in Wall show wind direction out of the southeast, east or northeast a whopping 55% of the time through July 28, according to the Mesonet. Last summer it was about 30%.

    Eighty-degree ocean water is possible come August

    Offshore winds should continue to be a focal point of the August forecast, and with the climatological peak of our ocean waters coming at the end of the month, a few 80-degree ocean water temperatures are very possible.

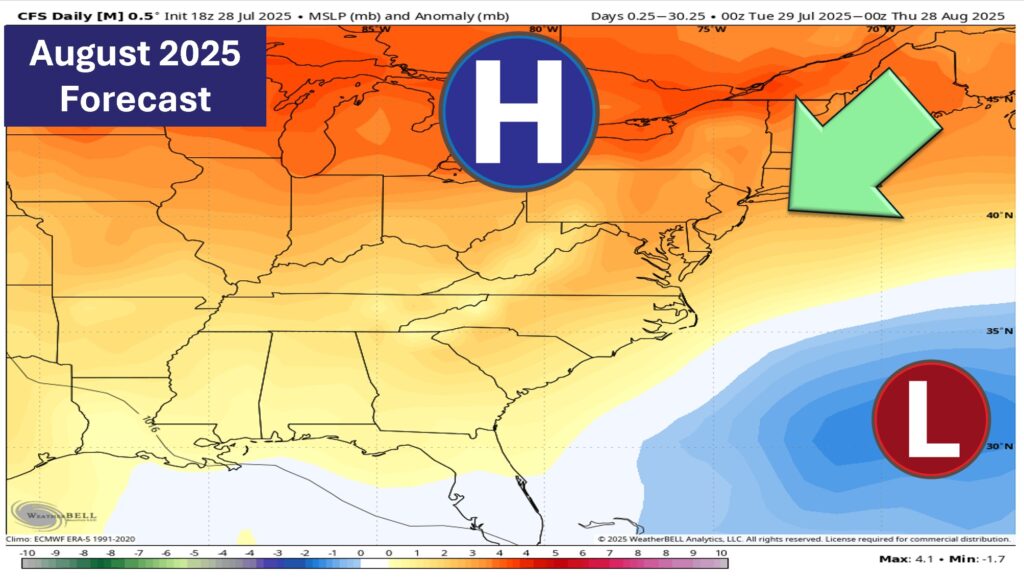
    While I’m not as keen on it as I was in our Halfway Through Summer Outlook column a few weeks ago, there is still a better-than-50% chance that the wind direction comes from the southeast, east or northeast more than average during August.

    August 2025 computer model sea level pressure forecast. Northeast winds are expected more than usual in August, bringing in relatively cooler air (via www.tropicaltidbits.com)

    We average at least one day with a water temperature at or above 80 degrees at the Atlantic City station in August. So, hitting 80 is not unusual. However, given the constant 70s we’ve had up and down the coast so far, more onshore winds would likely give us at least a few days in the tropical 80s.

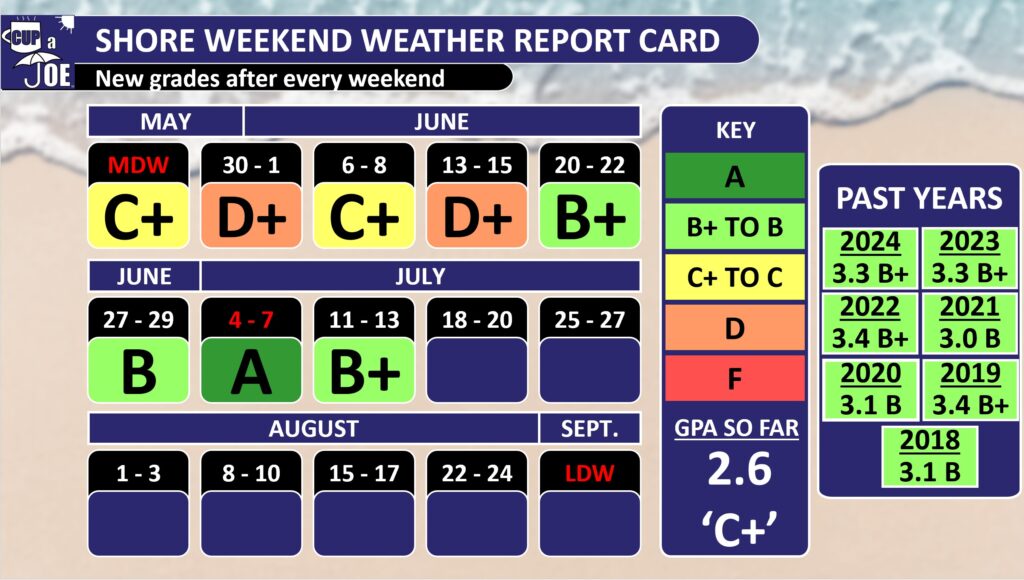
    Shore summer weekend weather report card update

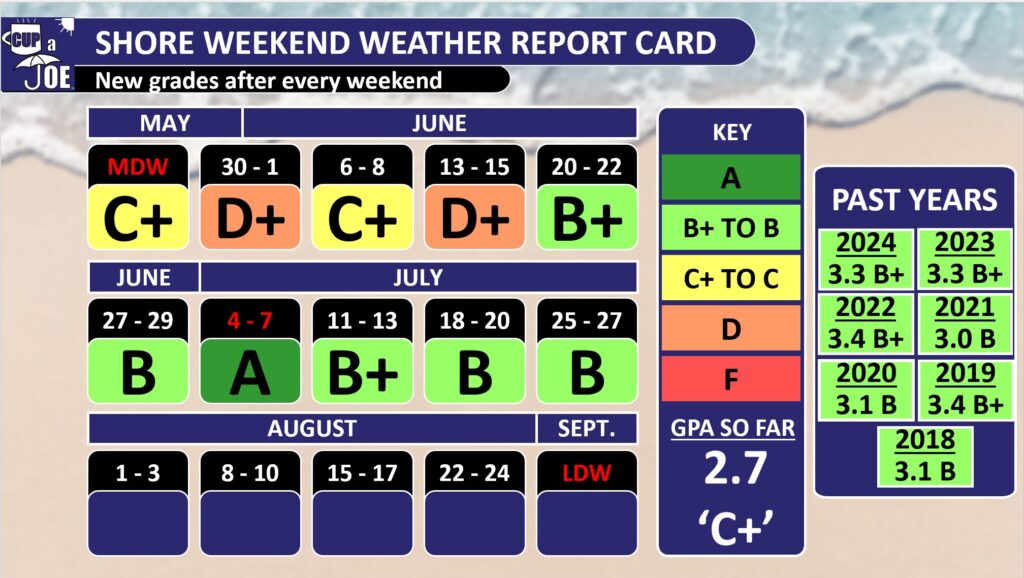
    The report card’s been holding its own over the month of July. However, summer 2025 will need to study hard, put in the work and give us beautiful, dry weekends for August in order to keep this summer out of last place.

    I graded the July 25-27 weekend a ‘B.’ That brings the grade point average since Memorial Day Weekend to a 2.7 – right around a B-minus.

    In the eight summers that I’ve graded the weekend weather, the lowest final grade point average was a 3.0 back in 2021.

    Climatologically, our weather becomes less rainy in mid-August. So, there’s still time to earn a few ‘A’ grades and dig out of last place.

    Joe Martucci, a Certified Broadcast Meteorologist and Digital Meteorologist, is the President and Director of Meteorology for Cup A Joe Weather and Drone. You can connect with him at cupajoe.sparkable.opalstacked.com/.
  • Our sweaty 2025 Jersey Shore summer is a sign of what’s to come

    Our sweaty 2025 Jersey Shore summer is a sign of what’s to come

    This article initially appeared in Shore Local News on July 24, 2025. Read it here!

    Climatological summer, which runs June through August, is a little more than half over and the data shows that the weather has had us all sweating more than usual at the Jersey Shore.

    The dew point, which measures how much water vapor is in the air in degrees, was much higher than usual at Atlantic City International Airport in Egg Harbor Township, and other places along the Jersey Shore, in June and July. In fact, the readings have been some of the highest on record.

    Here’s how to think about the dew point in terms of how it feels during the summer.

    40s = Dry
    50s = Refreshing
    60+ = A bit humid
    65+ = Noticeable
    70+ = Sticky
    75+ = Oppressive

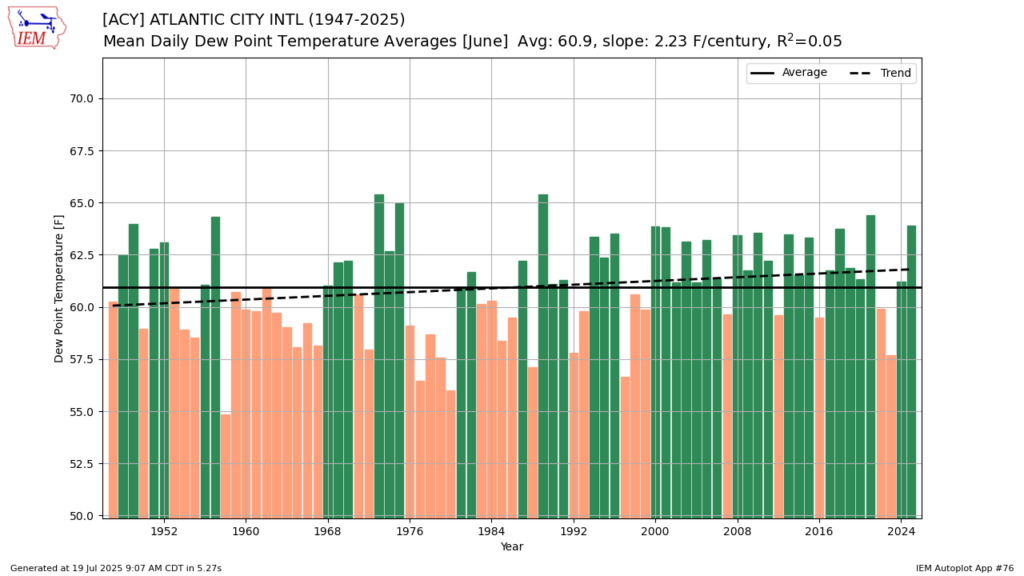
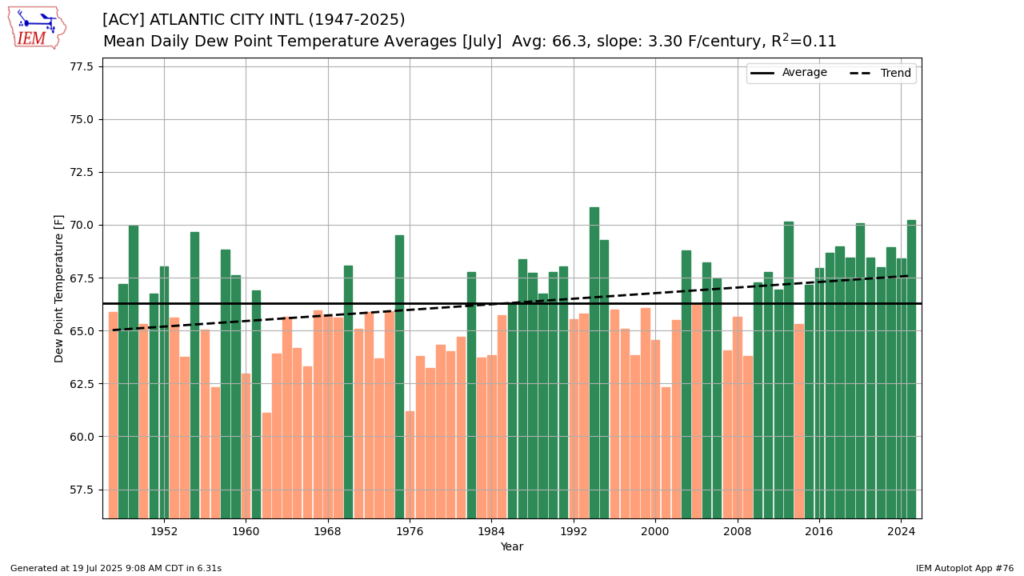
    At ACY Airport, June had the seventh highest dew point on record going back to 1947, according to the Iowa Environmental Mesonet. The month averaged a dew point of 63.9 degrees – three degrees above the average. Through July 18, that spiked to 70.2 degrees month-to-date. It’s the second highest on record and 4 degrees above average. Only 1994 was higher.

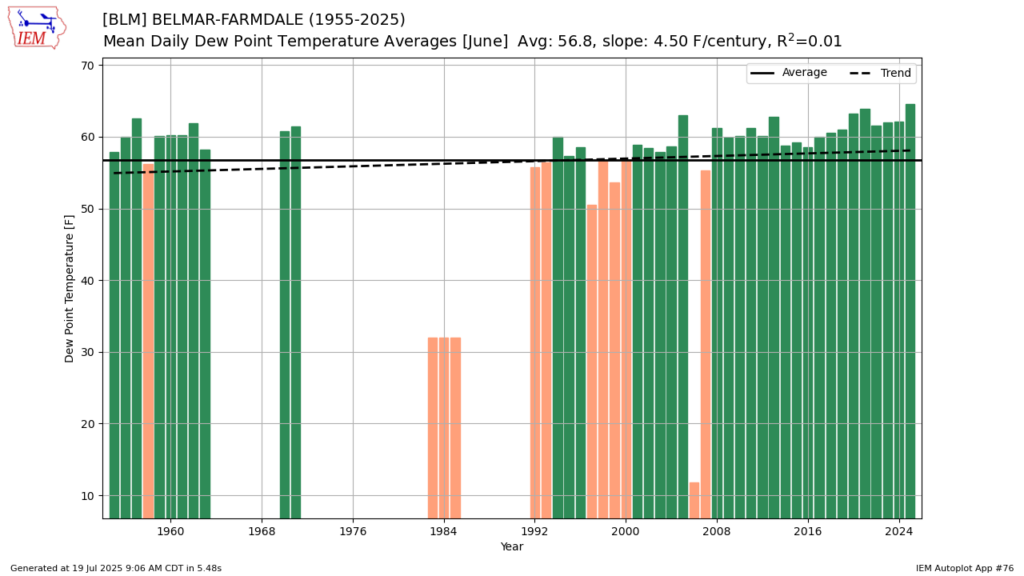
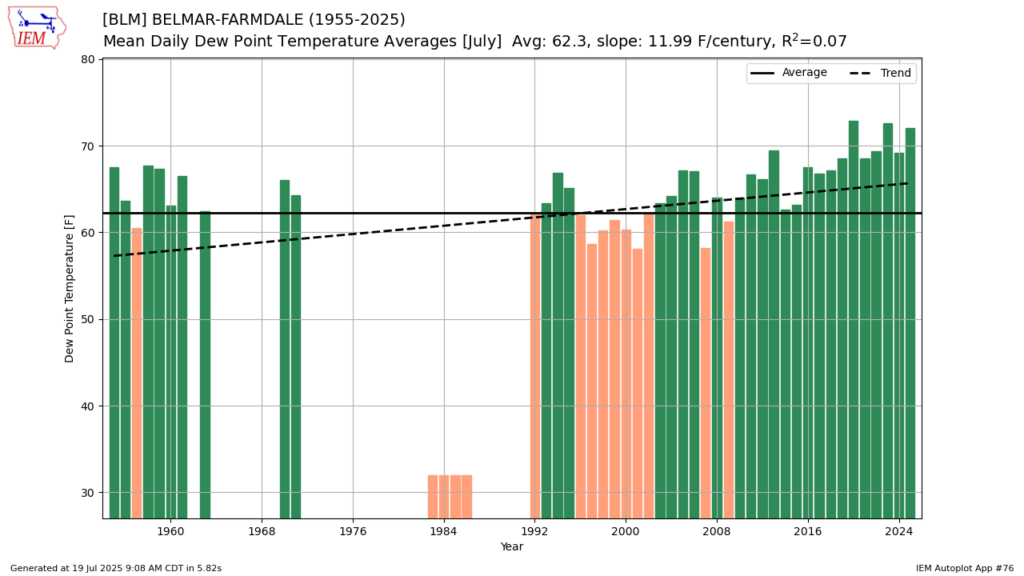
    It’s even more extreme farther north on the Jersey Shore. Monmouth County Executive Airport in Wall had the highest June dew point on record at 64.6 degrees. From July 1 to 18, the 72.1-degree dew point came in as the third highest on record for the period. Monmouth records go back to 1955, but weren’t consistently reported until 1992.

    It’s even more incredible that the dew point is this high considering that the first half of June was cooler than average and the dew point can never fall below the air temperature.

    You can thank our changing climate and local weather conditions for the sweaty feeling in the air.

    Why so humid? The weather side

    In New Jersey, any wind from the southwest, south, southeast or east is going to bring more humidity than usual. The winds from the southwest and south pump in that juicy air from the Gulf of Mexico (Gulf of America). Meanwhile, winds from the southeast and east will blow in moister ocean air.

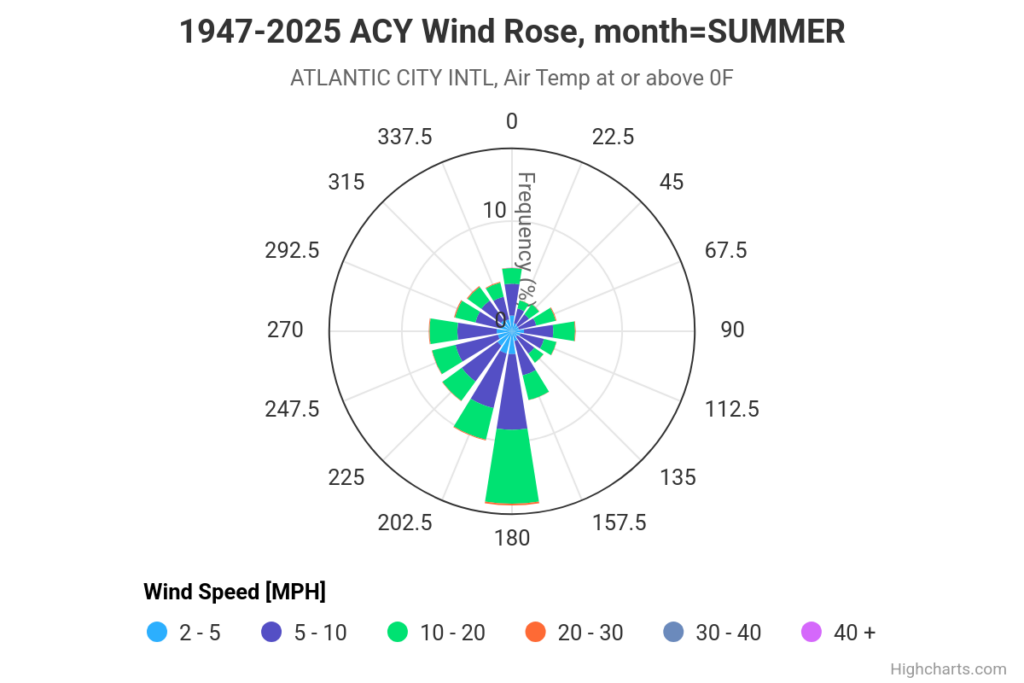
    Climatological summer, from June 1 to July 18, had winds blow from these directions roughly 55% of the time at Atlantic City International Airport, the Mesonet reports. The long-term average for the entire climatological summer is 35%. The different lengths of time mean this isn’t a perfect comparison, but it’s valid enough for this purpose.

    Along the shore, the wind at Monmouth County Executive Airport came from the more humid directions about 45% of the time this year. Usually, it’s only about 40%. The big difference is that the main wind direction this year was from the east.

    At ACY Airport, the wind mostly came from the south. This made the air feel extra moist, with the highest humidity in years.

    Humidity is a measurement of how much water is in the air compared to the air’s temperature. At ACY Airport, the humidity hit 71.9% in June – the highest since 2018. In July it reached 76% through July 18, the highest since 2021.

    However, summer humidity can be tricky to understand. The percentages in June and July are high, but in winter, humidity can be 90% or more for days. But it doesn’t feel as stickymbecause it depends on the air’s temperature. Warmer air can hold more water so summer feels much more humid, even if the percentage is lower than in winter.

    That leads me to the next point about this sweaty, sultry stretch.

    Why so humid? The climate change side

    As our summers have become hotter in recent decades, the atmosphere’s capacity for holding more moisture in the air has increased, too. That’s meant more days where the dew point can be a sticky 70 degrees or an oppressive 75 degrees.

    During July, dew points have increased 3.3 degrees per century at Atlantic City International Airport.

    The most recent July with a dew point below the long-term average was 2014, and 2009 before that. In June, it’s a long-term increase of 2.2 degrees per century.

    The data proves that it’s been muggier in recent decades. We can also take a look at the heat index, too. The heat index is what the temperature feels like to the human body, according to the American Meteorological Society.

    At ACY Airport and Monmouth County Executive Airport, the heat index – this is how hot it feels when you combine temperature and humidity – for June and July 2025 so far ranks between fifth and seventh place compared to past years. Almost all the years that felt hotter than this June and July happened after 2008, except for one June at Monmouth.

    However, here’s something interesting: in some places, the air’s humidity has actually gone down over time.

    At ACY Airport, humidity drops at a rate of 3.85% per century. In June 2025, the humidity there was only the 46th highest out of 78 years recorded by the Iowa Environmental Mesonet. For July so far, it’s ranked 26th. But at Monmouth County Airport, humidity has gone up instead.

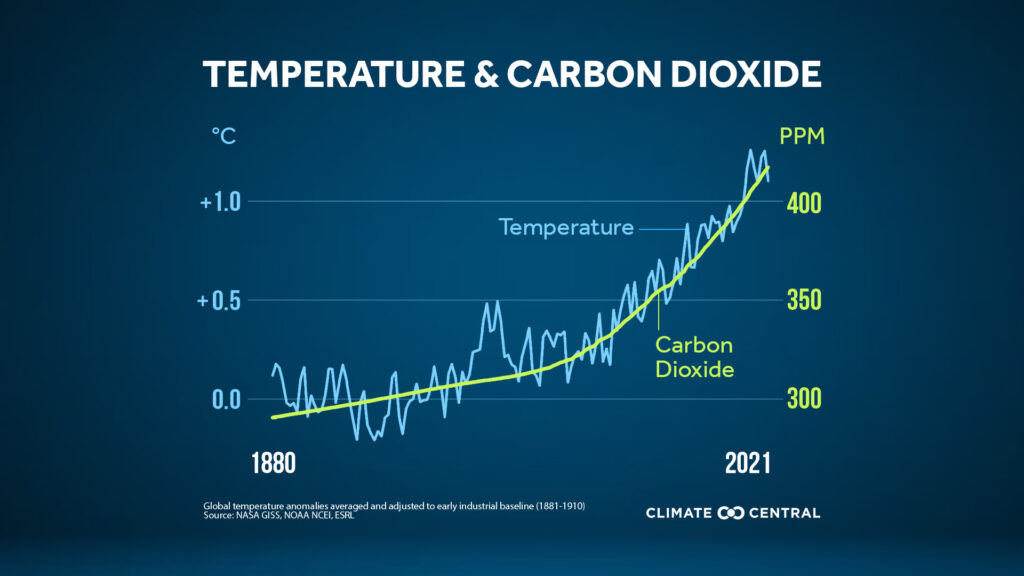
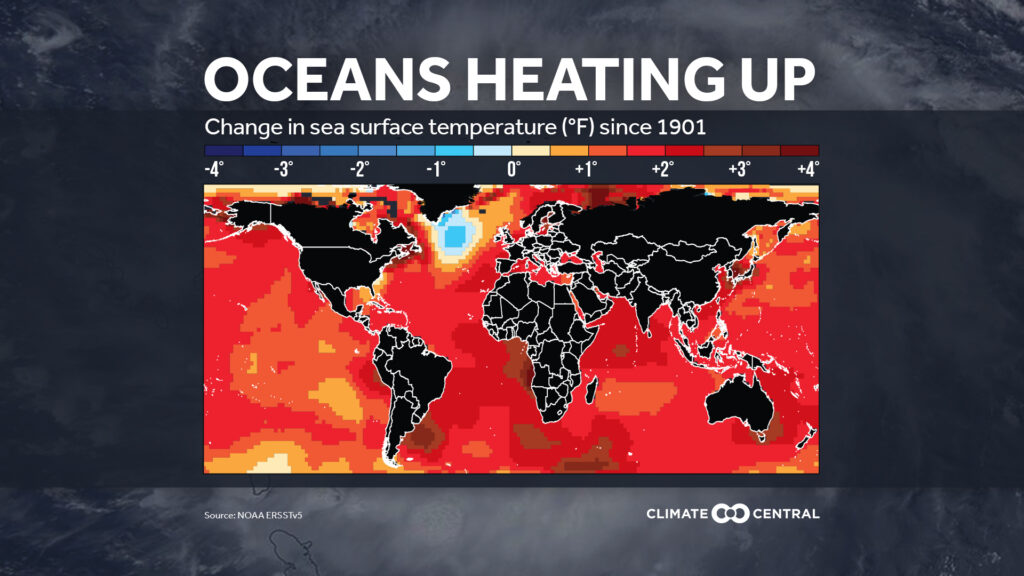
    Not only is the air getting warmer because of climate change, mostly caused by people, but the ocean water is getting warmer, too.

    When the ocean gets hotter, more water evaporates into the air. This makes the air hold more moisture, which raises the dew point – that’s the temperature when the air gets so full of water it starts to form dew. It also leads to bigger, heavier rainstorms.

    The sea surface temperature in the Gulf increased between 1.35 and 2.25 degrees Fahrenheit from 1970 to 2020, according to peer-review research published in the Journal of Climate in August 2022.

    Last August, Brian McNoldy, a climatologist for the University of Miami, found that the Gulf was the hottest ever recorded in modern times.

    The Atlantic Ocean on the United States East Coast increased between 1.8 to 3.6 degrees during the same time period, according to the National Oceanic and Atmospheric Administration.

    New Jersey’s more muggy summers will continue

    Given the decades-long trends of higher summer heat and higher summer water temperatures, expect more summers like the one we’ve had already in the decades to come. In fact, climate models project a 1.8 to 3.6 increase in dew points come 2050, compared to 2018, according to that year’s National Climate Assessment, which is mandated by Congress.

    Whether the increase in dew points due to climate change is a bad thing or good thing is not for me to say. However, expect more sweaty summers like this in decades to come.

  • 50% through summer weather recap: Extreme heat, severe storms & warm water

    50% through summer weather recap: Extreme heat, severe storms & warm water

    This article appeared in Shore Local magazine on July 17. It’s been updated to account for the lightning fatality in Jackson, Ocean County.

    After such a poor start to our weekend boat and beach season, it feels like summer is just getting into swing at the Jersey Shore. It might be hard to believe but the July 12-13 weekend marked the halfway point between Memorial Day and Labor Day. With six more weekends left to go until the season closes and “Locals Summer” begins, let’s look at the past and future of our weather for the coast.

    Jersey Shore weather so far

    Summer weekends in 2025 were a bad apple from the start. The cumulative grade point average through July 12-13 is 2.6. That’s a C-plus. In the eight years I’ve done the report card, it’s the worst start on record, and it’s not particularly close, either.

    The issue was the weekends from Memorial Day to June 13-15. In order, the letter grades were a C+, D+, C+ and D+. The reason for these gloomy, cooler weekends is part bad weather luck, and part science.

    The jet stream, the river of air between 25,000 to 40,000 feet above sea level that separates two air masses, sat right over the Mid-Atlantic. Kinks in the jet stream, called Rossby Waves, created areas of lower pressure. They take roughly a week to pass around the Earth. For us, they fell on the weekends for that spell. Furthermore, the hot and humid weather we all think of doesn’t usually settle in until mid-June. The combination of all of this led to a summer start of poor weather weekends.

    That being said, the ever important dry and warm weather for our shore economy was present during the middle of the week early in the season. That may have drawn more people to the shore than usual on those quiet, early June days.

    Once we hit June 20-22, the report card was between a “B” and an “A.” That “A” occurred right over the Fourth of July weekend. I was across the pond in Scotland and Ireland then. However, from what I saw online and heard from people, it was the best Independence Day weather weekend in years. We had plenty of sunshine, dew points in the refreshing 50s and decently dry 60s, plus no rain. It made up for lost time early in the season.

    The two big weather stories of the summer so far were the extreme heat June 21-26. Then the severe weather on July 8-9.

    Atlantic City International Airport reached 102 degrees for two days on June 24-25, the longest 100-degree or greater streak since 2011. On June 23, it tied a record high of 98 degrees, then set new records with the 102-degree days, smashing old records of 99°F and 96°F.

    Sen. Frank S. Farley State Marina in Atlantic City hit 93 degrees on June 23, breaking a 1909 record, and tied a 2002 record of 95 degrees on June 24. Both locations also set record high nighttime temperatures. Despite starting off with cool weekends, this summer has been a sizzler.

    Since climatological summer began on June 1, it has been the fifth hottest at Atlantic City Marina (records back to 1874), Atlantic City International Airport (records back to 1958) and Estell Manor (records back to 1964) through July 13. These numbers, courtesy of the Southeast Regional Climate Center, part of the National Oceanic and Atmospheric Administration, are over two degrees above the average.

    Most of the heat was driven by the overnight low temperatures, which are the warmest on record for Estell Manor and Atlantic City International Airport.

    Two weeks later, multiple nights of severe weather struck.

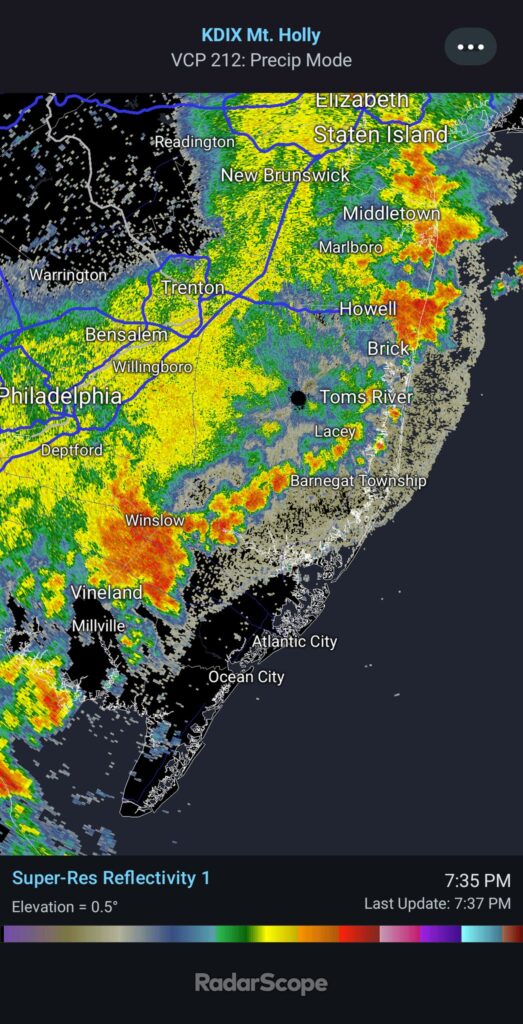
    On July 8, a tornado warning was issued for Burlington, Ocean, and Monmouth counties. Storms caused downed wires in New Egypt (Ocean County) and fallen trees in Lakewood (Ocean County).

    Radar from July 8’s line of severe thunderstorms that moved through the state. (Via RadarScope)
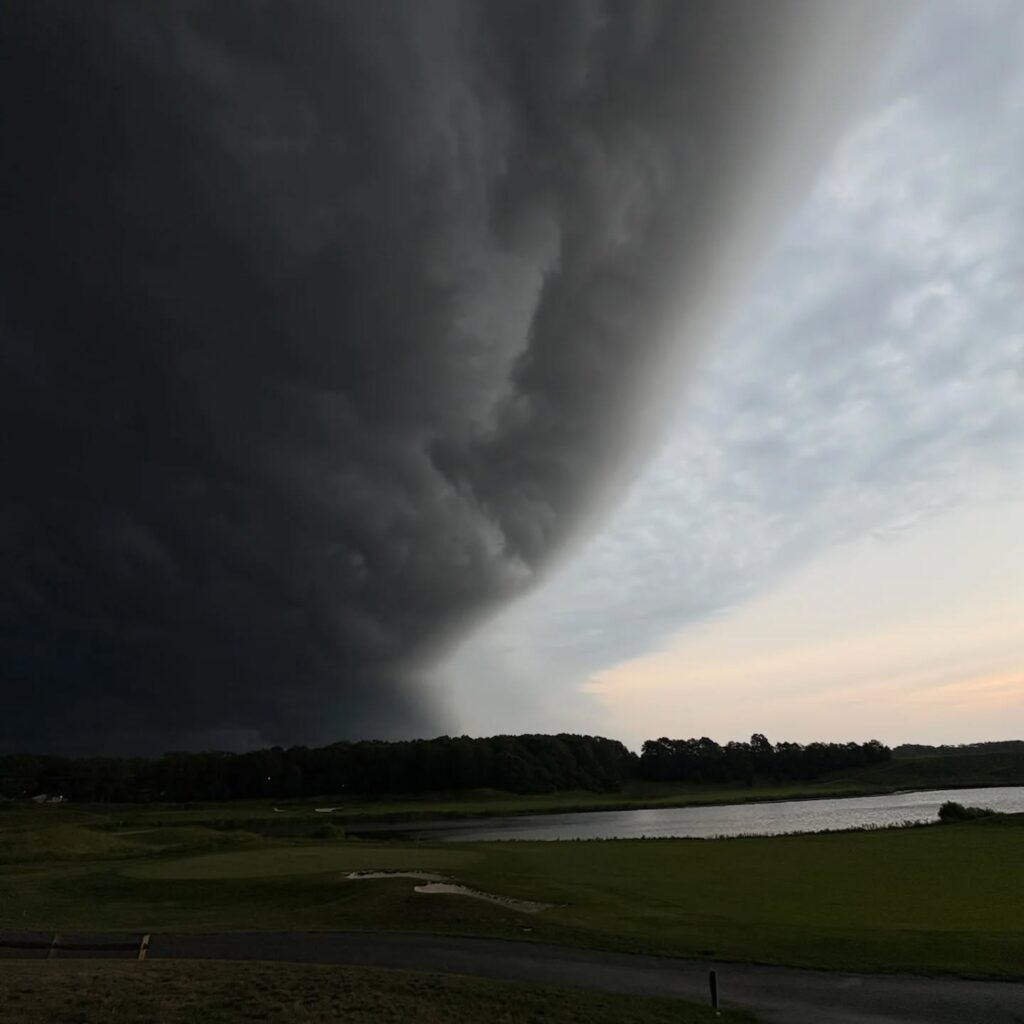
    A culmonmibus thunderstorm clouds casts a eerie, dark shadow over half of McCullough’s Emerald Golf Course on July 8. (Via Mark Melhorn)

    On July 9, another storm hit, with a tornado warning for parts of Atlantic and Ocean counties from 10:57 p.m. to 11:30 p.m. Winds hit 58 mph at Cape May-Lewes Ferry and 42 mph in Surf City. A flash flood warning covered the whole coast from Sandy Hook to Cape May, too. Thankfully, no confirmed tornados were seen at the Jersey Shore.

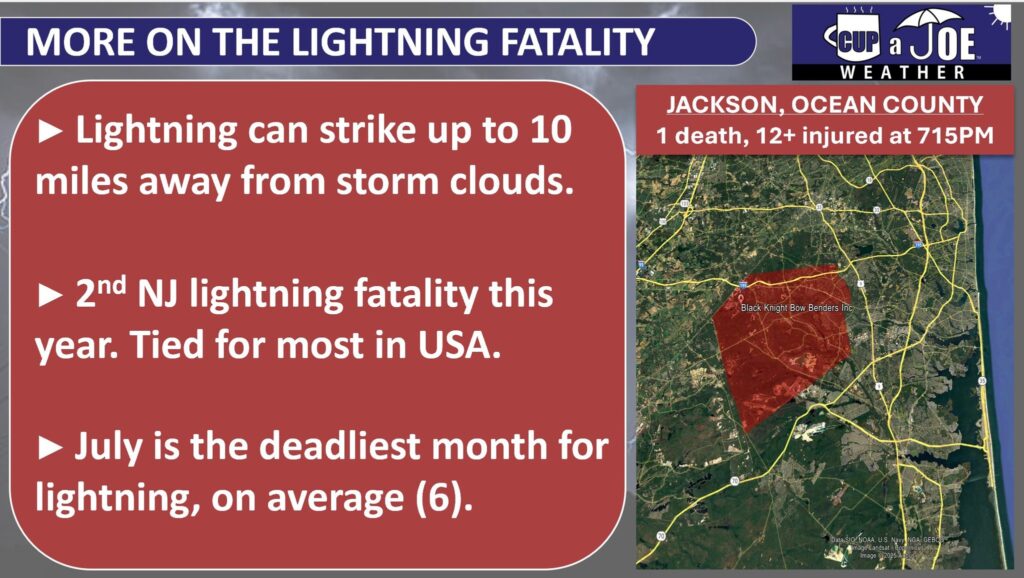
    While not right at the shore, there was also a lightning fatality in Jackson Township, Ocean County on July 15. A bolt of lightning struck an archery range, killing one and injuring over a dozen others who were there as part of a Boy Scout event.

    The other story since July began is the warm waters. Ocean water temperatures have been in the 70s for most of the month, and in the mid to upper 70s over the July 12-13 weekend. Consider the average water temperature this time of the year is in the upper 60s, and it’s been a treat. It’s also the complete opposite of last summer, where upwelling kept the ocean icy until early August.

    What’s the forecast for the rest of summer?

    Expect more muggier-than-average conditions for the rest of July. That means dew points in the sticky low 70s or oppressive upper 70s.

    In terms of temperatures, I expect more of what we’ve seen this summer for the rest of the month. Temperatures will continue to be above average but driven mainly by the balmy minimum temperatures. Average morning minimum temperatures are in the low 70s in the beach towns and upper 60s inland.

    We’ll likely have another inland heat wave (three or more days of 90-degree-or-greater heat) inland this month, perhaps two.

    However, that’s typical for us. I don’t see a repeat of the 100s we had in late June.

    For August, I’m pleasantly surprised to see particularly good computer model agreement that rainfall stays about average. It’s actually crazy. Models usually differ slightly. However, they are steadfast in dry weather in eastern New England and wet weather in the Appalachian Mountains. Average means eight to nine days of the month with wet weather.

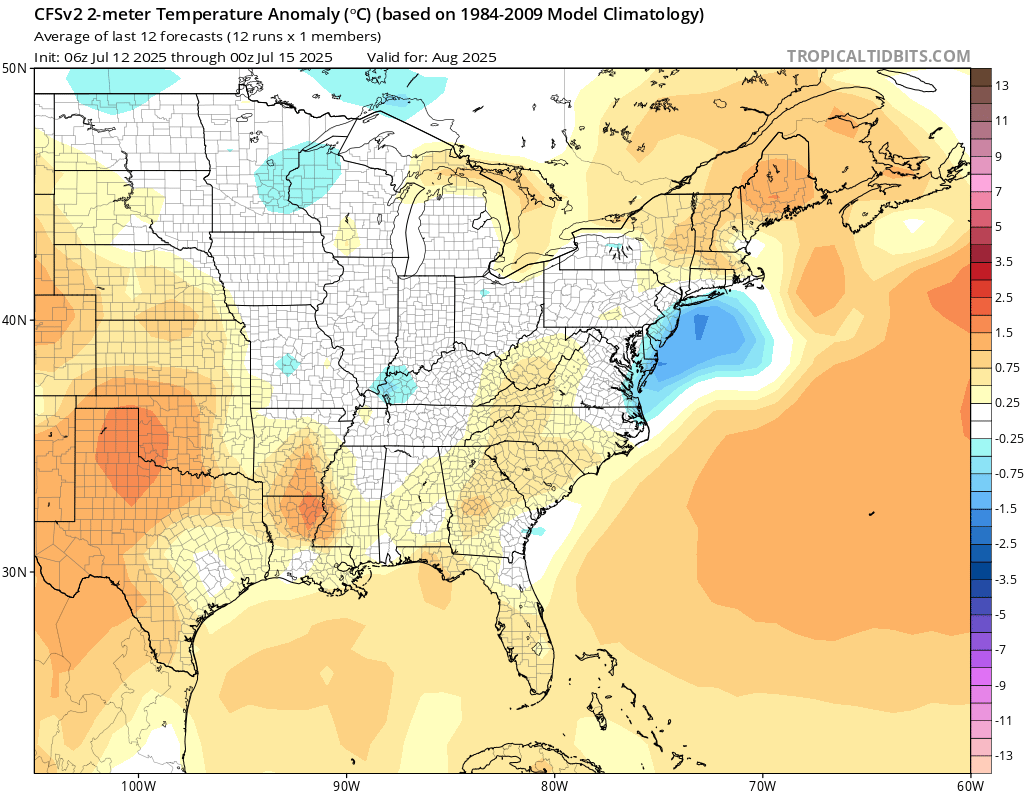
    In terms of temperatures, there’s also exceptionally good agreement that the shore counties stay a little bit below the average. Yes, if you’re tired of the summer heat, you should be in for a treat. Don’t expect autumn-like 60s for highs. However, less daytime highs in the 90s sound like a good bet at this time. Later in the month would start to see that hint of crispness in the air.

    The rain and temperatures are connected. Assuming the computer models are correct, high pressure would lock in offshore of Maine or Nova Scotia, Canada. Since high pressure spins clockwise, that would mean an onshore wind for much of the month.

    That would bring the relatively cooler air from the ocean. At the same time, the ocean waters in the pleasant 70s should continue. East winds shut off the cold upwelling that makes us shiver in the water on the hottest days.

    Monthly surface temperature computer model forecast for August, according to the CFS. Most long range forecast models paint a similar picture, with cooler than average air at the Jersey Shore. (Via TropicalTidibts.com)

    New Jersey’s hurricane season outlook

    So far, the state has been tropical cyclone free. Hopefully, we will keep it that way.

    According to Colorado State University’s hurricane forecast update on July 9, New Jersey has a 26% chance of a tropical storm being within 50 miles of the coast, with a 8% chance of a hurricane.

    That’s a small drop from the initial outlook in April and near the 1880-2020 average.

    Still, it’s always good to be hurricane ready.

    Have a NOAA Weather Radio. You can buy one easily online. Make sure your phone can receive weather alerts in an emergency.

    As we saw in the Texas floods, getting the alerts from the National Weather Service is a matter of life and death sometimes. Also, have a go bag ready with essentials in case you need to evacuate.

    Joe Martucci, a Certified Broadcast Meteorologist and Digital Meteorologist, is the President and Director of Meteorology for Cup A Joe Weather and Drone. You can connect with him at cupajoe.sparkable.opalstacked.com/.
  • Heat waves and safety top of mind at the Jersey Shore

    Heat waves and safety top of mind at the Jersey Shore

    This article initially appeared in the June 26th version of Shore Local magazine.

    Well, that changed fast. June gloom went to summer sizzle. High temperatures were in the 60s as recently as June 16 inland, and June 17 at the shore. Less than a week later, inland areas sweltered in the heat and humidity. Inland highs were in the 90s, with the sultry weather peaking earlier this week.

    In other words, the pattern shift from spring to summer is now done, like we talked about in last week’s column about the cool and wet weekends. While the official temperatures are not in at the time of this writing, it’s likely you have lived through your first heat wave of 2025 inland.

    With the heat increasing, both in the short term and the long term, knowledge is key to staying prepared.

    What is a heat wave?

    A heat wave in New Jersey is defined as three or more days of high temperatures at or above 90 degrees.

    Turns out, there is no official definition of a heat wave. The National Oceanic and Atmospheric Administration defines it as “a period of abnormally hot weather generally lasting more than two days.”

    The American Meteorological Society says “to be a heat wave, such a period should last at least one day, but…lasts from several days to several weeks.”

    The idea of using 90 degrees stems from A.T. Burrows. In 1901, he said a heat wave was when there were three or more days of heat that were above 90 degrees.

    While we use that definition in New Jersey now, that doesn’t make sense for the Deep South. Jackson, Miss. has an average high temperature in the 90s from June 11 to Sept. 8. While it’s hot, that’s part of their climate.

    Moreover, that doesn’t work in Seattle, where they average 2.5 days in the 90s each year, according to the Iowa Environmental Mesonet.

    Heck, it doesn’t even really work in the beach towns here in New Jersey.

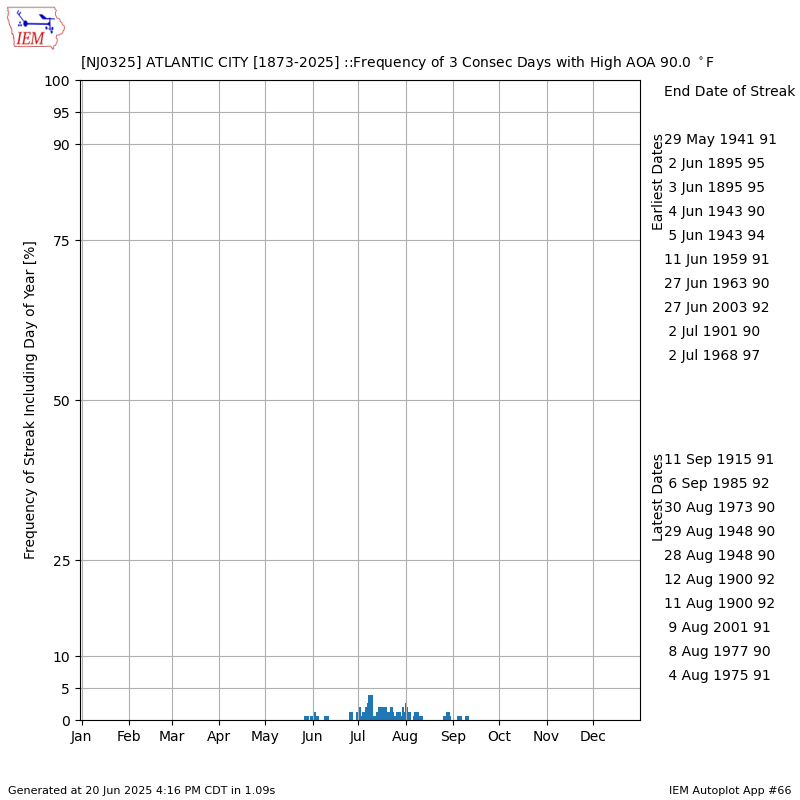
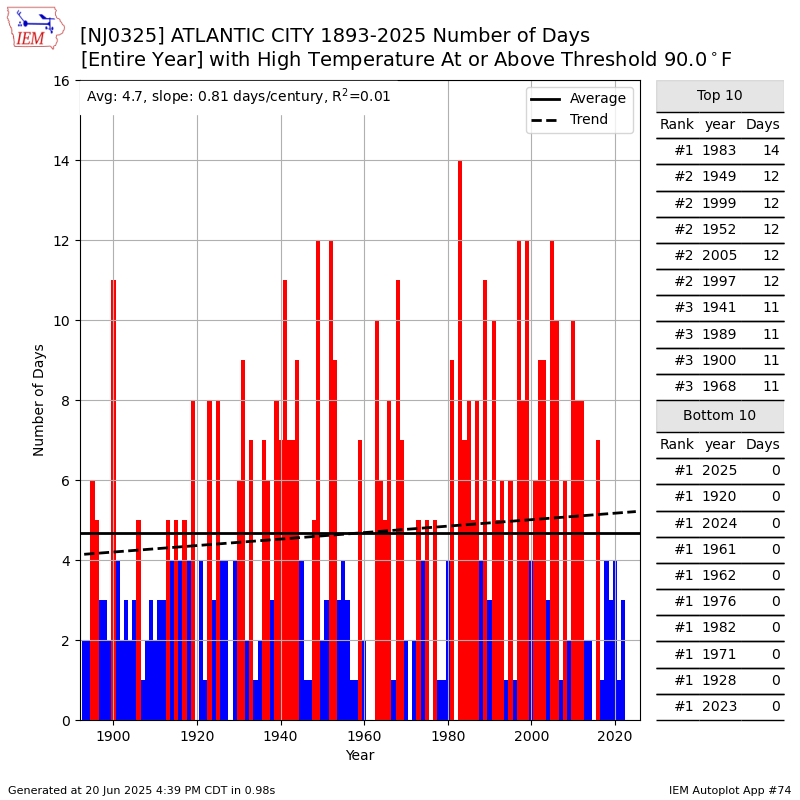
    The Sen. Frank S. Farley State Marina in Atlantic City averages 4.4 days a year with a temperature of at least 90 degrees. Using the New Jersey heat wave definition, the last one for the city was July 2011.

    Heat waves rarely happen at the Jersey Shore beach towns (via the Iowa Environmental Mesonet)

    You can figure the same for all of the barrier island beach towns at the Jersey Shore (note that most Monmouth County beaches are not barrier islands and see highs of at least 90 degrees more often, but still not as often as inland towns).

    In 2022, I asked those in the local weather news space to comment about what a heat wave is for their viewing area. Central California goes by three days of 100 or more heat. In Amarillo, Texas, it’s three days of 105 heat. In Austin, it’s a week at least in the 100s.

    Has New Jersey seen more heat waves over time? To keep it simple, we’ll just use the three days over 90-degree threshold for both the beach towns and inland areas.

    Plus, to keep the answer simple, yes there has been an increase in the number of heat waves over time. Here are the number of heat waves, per decade at Atlantic City International Airport per the Iowa Environmental Mesonet.

    • 1940s: 11
    • 1950s: 13
    • 1960s: 17
    • 1970s: 14
    • 1980s: 24
    • 1990s: 22
    • 2000s: 28
    • 2010s: 36
    • 2020-2024: 20 (on pace for 40)

    Most of that increase has been during July and August, our two hottest months of the year. Nowadays, you can expect about four heat waves a year.

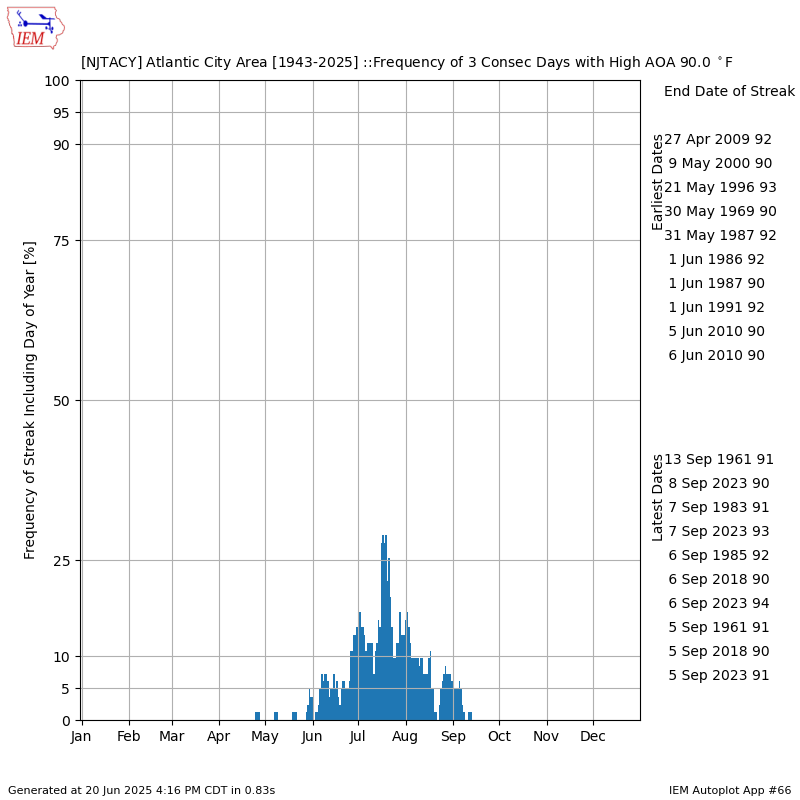
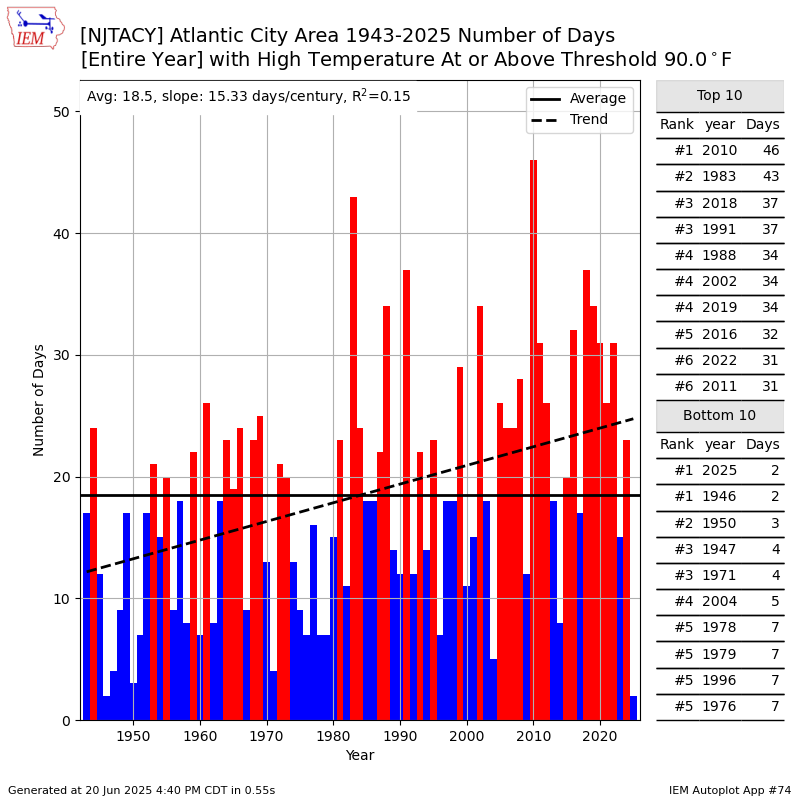
    Heat waves are more frequent inland, at Atlantic City International Airport (via the Iowa Environmental Mesonet)

    Go to the coast and there’s also an increasing trend in Atlantic City. However, since there are so few of them, with the last being in 2011, it’s not as strong of an increase as inland areas. Plus, there’s no real change in what month they’re happening more often.

    Remember, too, that the threshold is 90 degrees. A week with 90s, except one for one day where it’s 89, would count as two heat waves instead of one. Still, the data shows an overall increase in the number of 90-degree days throughout the region. That’s especially true for the airport, which is always warmer than the coast in the summer.

    What’s causing the increase in heat waves?

    Human influence on Earth is mainly responsible for this increase in two different ways.

    First, there’s been an increase in greenhouse gas emissions since the Industrial Revolution in the 1700s. The more carbon dioxide, methane, etc. that is in the atmosphere, the greater the ability for the sun’s heating rays to hit the ground, reflect back into the sky, only to bounce back down again off the emissions.

    Secondly, there is an increase in roads, roofs and parking lots. These dark surfaces absorb more heat than the green gas, trees or the white sand. So, when the sun is down at night, that stored-up heat releases itself into the atmosphere, keeping our air warm (weather stations take readings about 6 feet high).

    Summer heat safety tips

    Staying healthy during heat waves requires some changes in lifestyle. Staying in the air conditioning, if you have it, is your best defense against the scorching heat. During the summer, the state of New Jersey works with towns and counties to open cooling shelters by you.

    In Atlantic County, the county libraries in Absecon, Egg Harbor Township, Mays Landing, Pleasantville and Somers Point are open for you. If you’re in Cape May County, the emergency management website provides a list of cooling shelters when needed.

    Deciding to go to the beach or pool to cool off is a great idea. However, even going there can be hazardous on the hottest days. The salt water at the beach can dry you out, and you’re still feeling the humidity next to the ocean. Drink plenty of water.

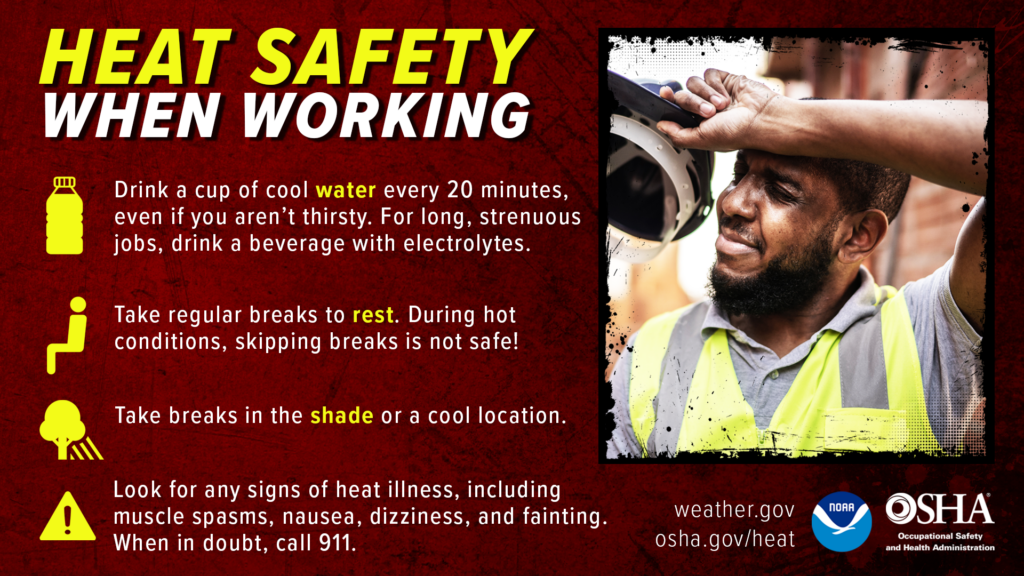
    If you’re working outside, you should have 8 ounces (a cup) of cool water every 20 minutes. Take frequent breaks, between 10 a.m. and 4 p.m., when the sun is strongest. If you can do that in the shade, it’s even better.

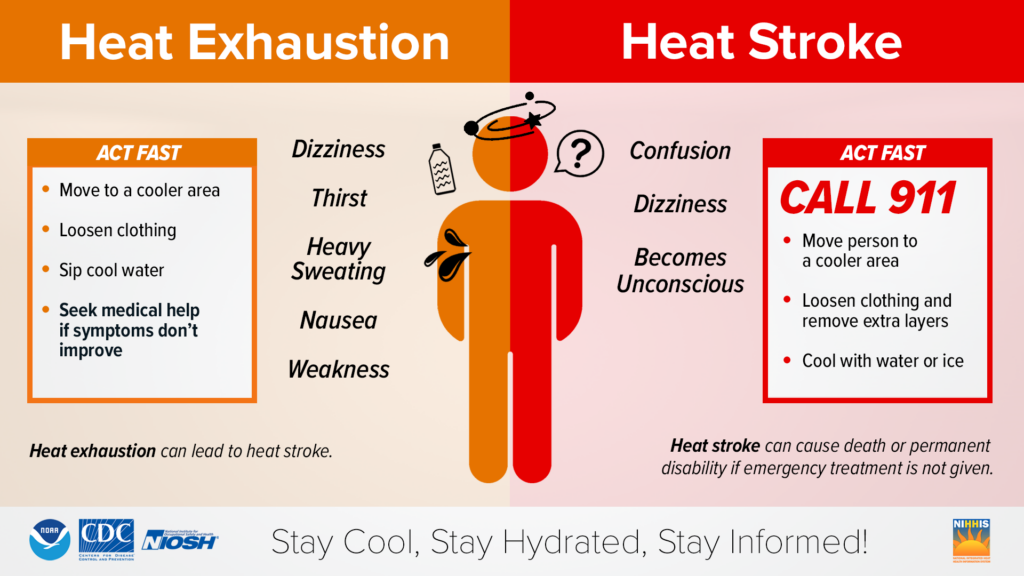
    Finally, know the symptoms of heat exhaustion or heat stroke. Heat exhaustion brings thirstiness, heavy sweating, nausea and weakness.

    You can combat this by moving to a cooler area, loosening clothing and sipping water. I had heat exhaustion in Italy in 2019. If you know Europe, you know air conditioning is optional, despite Italy being as hot as it is here. Going into a museum, I got nausea and sweated heavily. We took a car back to our hotel room where we put the air conditioning on as low as possible. I was done for the rest of the day, but much better by nightfall.

    Heat stroke, meanwhile, is a medical emergency. Call 9-1-1, get into a cooler spot and get ice on you as soon as you can.

    Heat is the biggest killer in the United States, unfortunately. It has been every year since 2016, according to NOAA. However, just a little extra attention to what you are doing outside during heat waves goes a long way.

    Joe Martucci, a Certified Broadcast Meteorologist and Digital Meteorologist, is the President and Director of Meteorology for Cup A Joe Weather and Drone. You can connect with him at cupajoe.sparkable.opalstacked.com/.
  • The Shore Summer Weekend Weather Report Card Grading Criteria

    The Shore Summer Weekend Weather Report Card Grading Criteria

    It’s the annual tradition! Every weekend, from the unlocking of the beaches Memorial Day to the Labor Day that just passed us, we grade the weather at the shore.

    The grading is subjective. However, after listening to you, I think it’s fair to say an ‘A’ means the weekend’s weather had:

    1) A high temperature between 75 and 85 degrees.

    2) No rain.

    3) Anything from a partly sunny to sunny sky. We could all use a few clouds to break up the sun.

    4) Low humidity.

    5) A gentle breeze.

    Since this is an average of all the days, a few hours of cloudy sky won’t ruin a perfect ‘A’.

    At the same time, this is for the whole shore. A weekend where Brigantine sees pouring rain while Asbury Park is dry won’t mean an ‘F’ either.

    Since this is summer, weekends start early. My report card includes Friday, Saturday and Sunday. Memorial Day and Labor Day are also included in those weekends, too. Fourth of July’s weekend is based on what day of the week it occurs.

    Sunday or Monday – Counted in with the Friday before the date.

    Tuesday or Wednesday – Counted as a standalone date

    Thursday, Friday or Saturday – County in with the weekend or Sunday following.

    See when the climate says beach weather settles in at the Jersey Shore and when the ‘A’ are most likely to come.

  • 6 awesome hurricane updates you’ll see in 2025

    6 awesome hurricane updates you’ll see in 2025

    By Meteorologist Joe Martucci

    This article initially appeared in Shore Local magazine on May 29.

    Hurricane season begins on June 1. Really, in New Jersey, we like to say that there’s a 12-month hurricane season. After all, it’s the water, not the wind, that causes the most devastation, and nor’easters bring plenty of water.

    Sadly, the 30-year average for flood deaths is 113 a year, compared to 78 for winds in the United States, according to the National Weather Service. Safety, preparation and information are at the top of every meteorologist’s mind, including the fine folks at the National Hurricane Center in Miami, Fla. Every year they come out with new products, updates and changes to keep you as safe as possible from hurricane season, which will end officially on Nov. 30.

    This year, there are six. They range from rip currents to wind forecasts, to the change in the size of the forecast cone that you see. Here are the updates below, including how you’ll be able to see them.

    Inland watches and warnings on the forecast cone map

    The forecast cone is the essential part of understanding what is going on with a tropical system. The cone shows the forecasted path, along with data on location, movement, wind speed as well as watches and warnings.

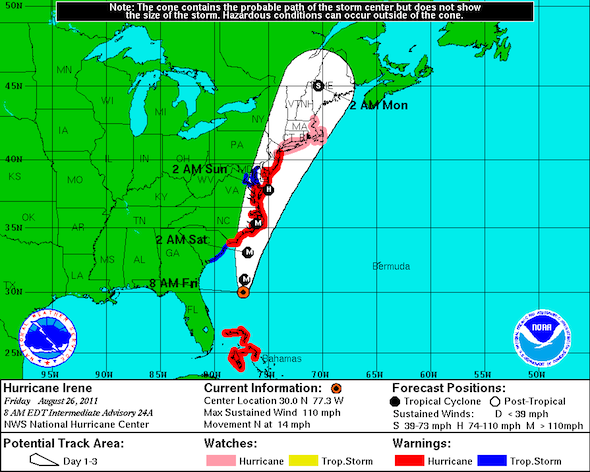
    Before 2024, only the coast was outlined in the applicable watches and warnings (Tropical Storm Watch, Hurricane Warning, etc.) on the map. However, these alerts often went well inland and there was no way to see that on the map.

    Current conditions and forecast cone for Hurricane Irene in 2011. New Jersey was 48 hours away from landfall, which came ashore as a weaker. tropical storm. Note that red hurricane warnings only outline the coast (National Hurricane Center).

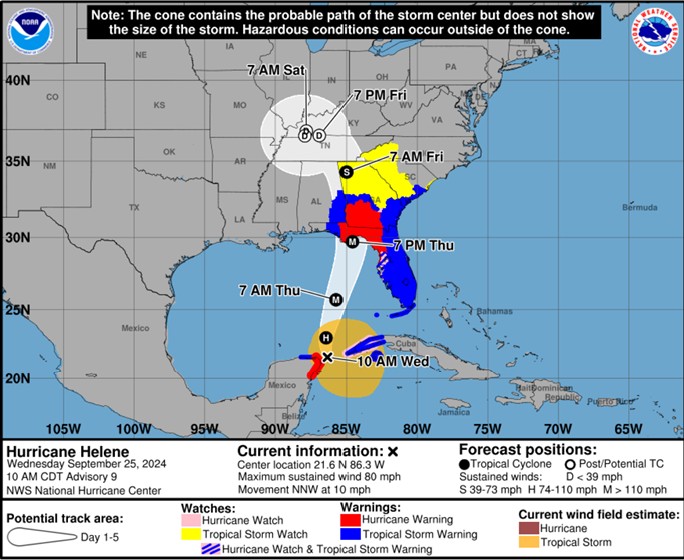
    Last year, the NHC added all areas that were in watches and warnings to the map, whether they were a coastal county or not on an experimental basis. This year, they continue to keep it, but “will now contain the symbology for areas where a hurricane watch and tropical storm warning are simultaneously in effect (diagonal pink and blue lines).

    Current conditions and forecast cone for Hurricane Helene in 2024. Note that red hurricane warnings extend inland to Florida and Georgia. also, there is a shaded pink and blue area in the Tampa, west coast, region of Florida (National Hurricane Center).

    So, if the Jersey Shore counties were in a hurricane warning, and the inland New Jersey counties were in a tropical storm warning, all of the counties would be colored in on the map. If Atlantic County were in a hurricane watch and tropical storm warning, it would have a diagonal pink and blue line over the county. This came in handy during Hurricane Helene last September. Tropical storm watches were in effect as far inland as western North Carolina.

    Before 2024, you would only know that if you lived in those counties, saw a news segment on it, or dug deep into the National Hurricane Center website. However, last year, you could see it right on the map. Of course, Helene brought catastrophic flooding to western North Carolina — $79 billion in damages were estimated to have occurred, according to the National Hurricane Center.

    Rip current risks shown

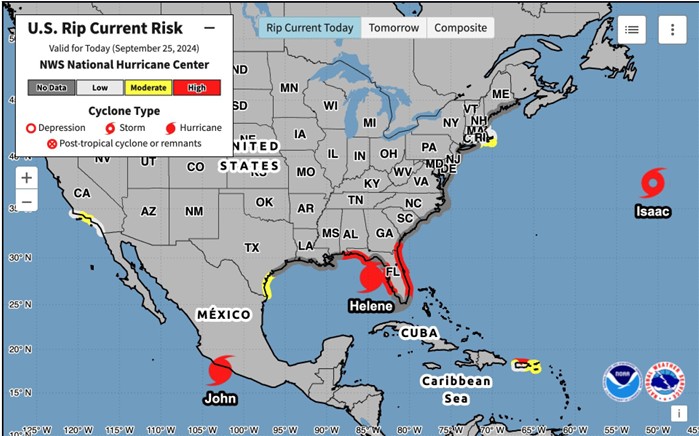
    When a tropical storm or hurricane is active in the Atlantic Hurricane Basin, the National Hurricane Center will provide rip current risk information on a national map. This also includes places like Puerto Rico and Guam.

    The rip current risks will be provided for the day of and the next day, along with a map showing the highest risk over the next two days. This is really for people who want a more national view of what’s happening.

    Our National Weather Service local office has put out rip current and surf information for years. You can also check out my Sea and Sand video forecasts for Jersey Shore specific information. However, this is a great way to see the risks in one place.

    The National Hurricane Center’s new Rip Current Risk map interface.

    More lead time for undeveloped storms

    June, July, October and November can bring tropical storms or even hurricanes that quickly develop and make landfall on the East Coast. Tropical Storm Fay made landfall at the Edwin B. Forsythe National Wildlife Refuge at the far southern end of Long Beach Island at around 4 p.m. on July 10, 2020. It became a tropical storm just 23 hours earlier. However, the hurricane center knew Fay would hit New Jersey as a tropical storm even before it became a tropical system.

    This update is for situations like this. The National Hurricane Center can issue tropical cyclone advisory products, like forecast updates, watches and warnings, 72 hours before the storm surge or wind hit land, regardless of the storm’s status at the time. Last year, it was 48 hours. So, this is an extension of it.

    Extended wind radius forecast

    The category of a tropical system is based upon the maximum sustained wind speed. However, tropical storm force winds (39 mph or greater) or hurricane force winds (74 mph or greater) can extend for long stretches beyond the core of the storm.

    You have to dig through the hurricane center’s website for it, but they do forecast the size of tropical cyclone wind fields in each of the storm’s four quadrants: northeast (most destructive part), southeast, southwest and northwest).

    In the past, the hurricane wind radius forecasts went out 48 hours. This year, it will go out 72 hours, a testament to the improving accuracy of hurricane forecasting. To find this, search for the “Tropical Cyclone Forecast/Advisory product” when a storm is active. It’s abbreviated as TCM, too.

    Forecast track cone will shrink

    Most of the above updates are due to the impressive work done by the meteorologists at the National Hurricane Center. Hurricane forecasts have become better with time, allowing more useful information to be given to you, with bigger lead times.

    Each year, the hurricane center updates the size of their track forecast error cone. This is based on the accuracy of the storm’s track over the past five years.

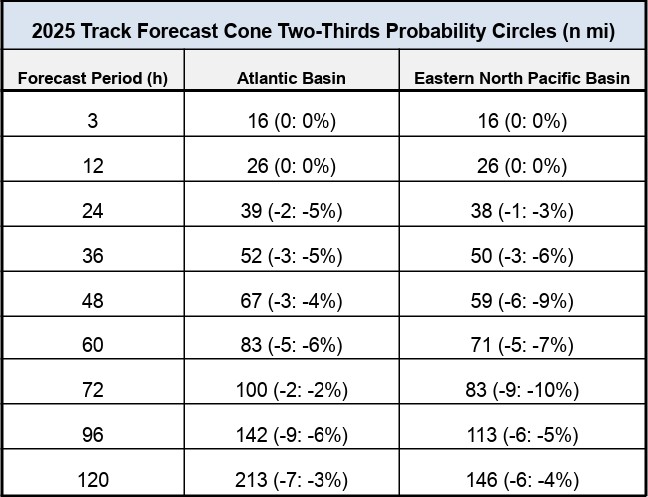
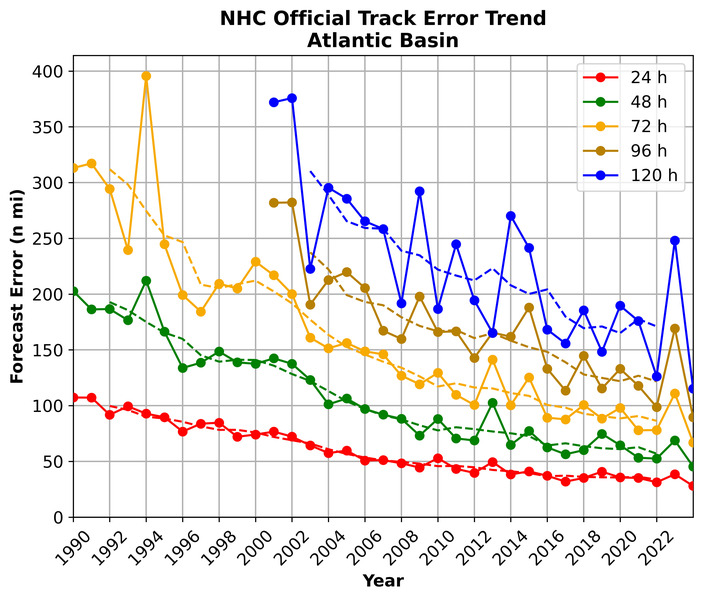
    This year, the size of the cone for the Atlantic Hurricane Basin will be smaller at seven of the nine forecast periods from 3 to 120 hours out. This includes all periods 24 hours and later. The most significant will be a 6% reduction in size for the 60-hour and 96-hour forecast.

    How the size of the forecast cone will change for the Atlantic and Pacific Hurricane Basins in 2025, compared to 2024 (National Hurricane Center).

    As an example, a larger cone in 2024 could have Atlantic City on the edge. However, thanks to this improvement, Atlantic City could be out of the cone. That has huge implications for emergency management operations, evacuations and more.

    The forecast cones show where there’s a 66% chance of the storm’s center making landfall. This is important. It does not indicate where the impact of the storm will be, and it’s not guaranteed. Again, though, the National Hurricane Center has made big gains in forecasting the track of tropical storms and hurricanes.

    The official track error trend for Atlantic Hurricane Basin storms. Note the decrease in error since 1990 on all time scales.

    Major update to Hawaii forecasts

    The likelihood of a certain height of storm surge hitting a coastline is now operational in Hawaii. It’ll be initiated by the National Hurricane Center’s Storm Surge Unit and made available within 72 hours of hurricane impacts. Storm surge forecast maps began on the mainland United States in 2016.

    Watch our Interview with the National Hurricane Center Director

    If you go to my YouTube or Facebook pages (@JoeMartWx), catch a special interview with Michael Brennan, director of the National Hurricane Center. It’s all part of the Tidal Flooding Talk show I co-host with Dan Skeldon (a familiar name to many), and Palma Shiles as part of the New Jersey Coastal Coalition. When you have 30 minutes, give it a watch or listen.

  • When is it really beach weather season in NJ?

    When is it really beach weather season in NJ?

    This article originally appeared in Shore Local News on May 22.

    We shivered through our coldest winter in 10 years, held our hats during the windiest winter in 15 years, and lived the rollercoaster temperature ride of spring. Now Memorial Day weekend is here. It’s the unofficial start of summer.

    There’s an old saying for our beach season weekend holidays. It’s some variation of:

    Memorial Day we shiver.

    Fourth of July we sweat.

    Labor Day we shine.

    We all want a fun Memorial Day weekend. It helps our stores make money when visitors and part-time homeowners come back. It’s great for people who want to return to their favorite slice of sand for a few months, and it’s an awesome place for our kids and grandkids to have a good time, and our families to make memories.

    But Memorial Day is in late May, during spring. That means the weather can be unpredictable and change a lot.

    Looking at my Shore Summer Weekend Weather Report Card, the holiday weekend earned an average grade of C-plus between 2019 and 2024. That being said, the past three years all earned at least a B.

    Using climate as our barometer (no weather pun intended), steady beach or boating weather begins in mid-June and ends after the Labor Day holiday, in mid-September. I use criteria from my Shore Summer Weekend Weather Report Card as a guide, with temperatures at or above 75 degrees, winds under 15 mph and a lower risk of widespread rain makers as the main benchmarks.

    Temperatures

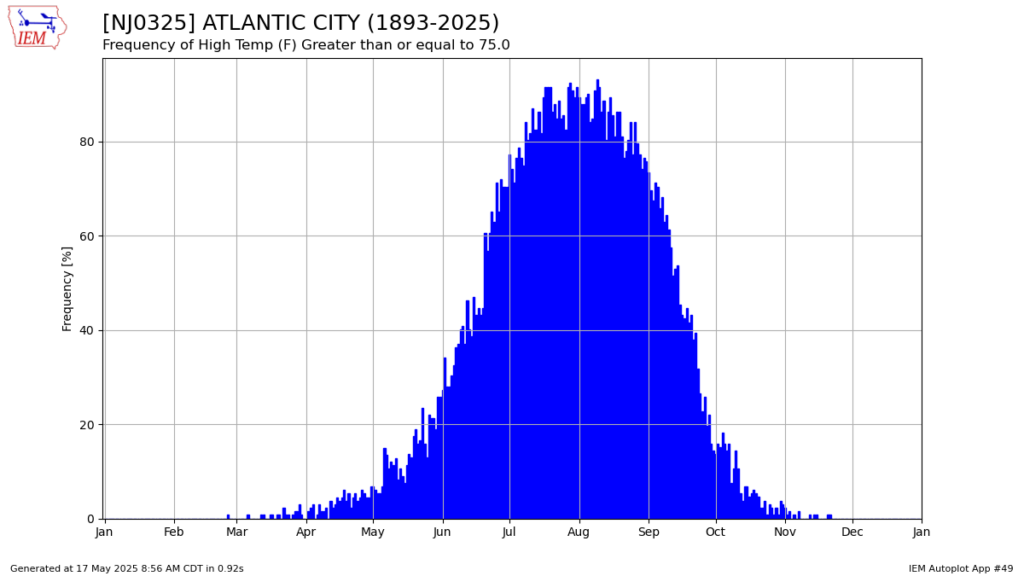
    Per the National Oceanic and Atmospheric Administration (NOAA), at Sen. Frank S. Farley State Marina in Atlantic City, the average high temperature hits 75 degrees on June 14. It then peaks at 81 degrees from July 12 to July 27, then it falls, dipping under 75 degrees for the first time on Sept. 15.

    For about three months, it’s usually warm enough to wear a bathing suit and stay outside all day. From July 4 to around Aug. 20, beach weather is nearly guaranteed. There’s an 80% chance the temperature will be 75 degrees or higher, according to the Iowa Environmental Mesonet.

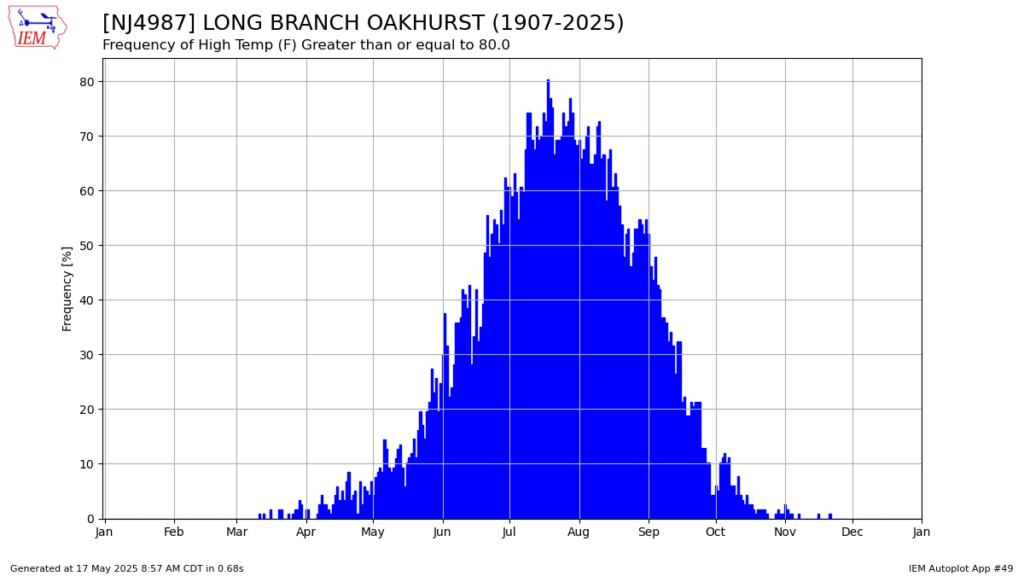
    I checked the weather in Long Branch, Monmouth County, where the monitoring station is about a mile from the ocean. There, the average high temperature is 75 degrees or more from June 6 to Sept. 21. It’s nearly the same as Atlantic City.

    Winds

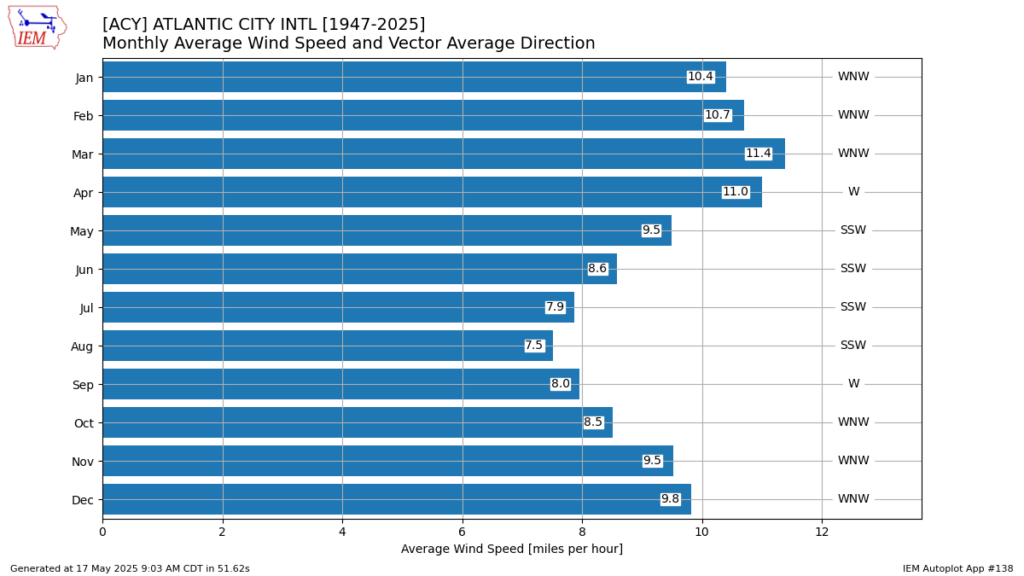
    It’s proven that winds weaken in the summer.Our least windy time of year is July through September, which fits in fairly well with the temperatures. We look to Atlantic City International Airport for this data from the Iowa Environmental Mesonet.

    May: 9.5 mph

    June: 8.6 mph

    July: 7.9 mph

    August: 7.5 mph

    September: 8.0 mph

    October: 8.5 mph

    As the Earth’s axis tilts and the Northern Hemisphere warms, wind-making systems, including nor’easters and powerful cold fronts, stop passing here around mid-June. This lasts through about mid-October.

    Of course there are tropical storms and hurricanes that bring plenty of wind. While we always need to prepare, our likelihood of experiencing one is fairly low. This year, Colorado State University gives New Jersey a 29% chance of a tropical storm, and a 9% chance of a hurricane impacting our coast.

    Steady rain

    From mid-June to mid-October, widespread rain makers are hard to come by here in New Jersey. Just like the winds, the nor’easters and powerful cold fronts, the weather systems that would bring widespread rain don’t impact us this time of year.

    However, this time of year is when thunderstorms happen a lot. They’re most common from June 15 to Aug. 15, based on info from Atlantic City International Airport. A thunderstorm might change your beach plans for a few hours, but the all-day rainy days we see in spring are pretty rare.

    Shifting climate

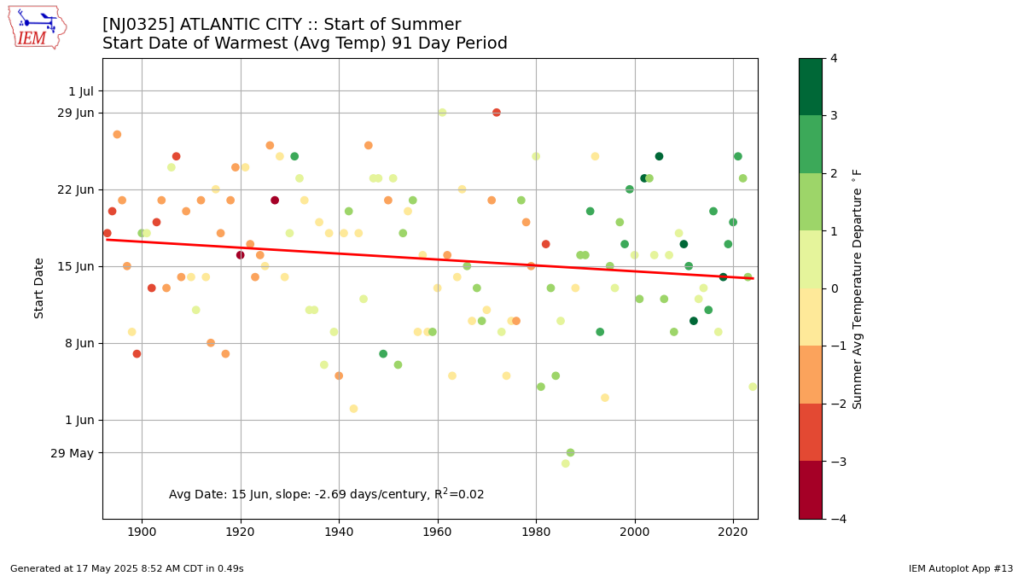
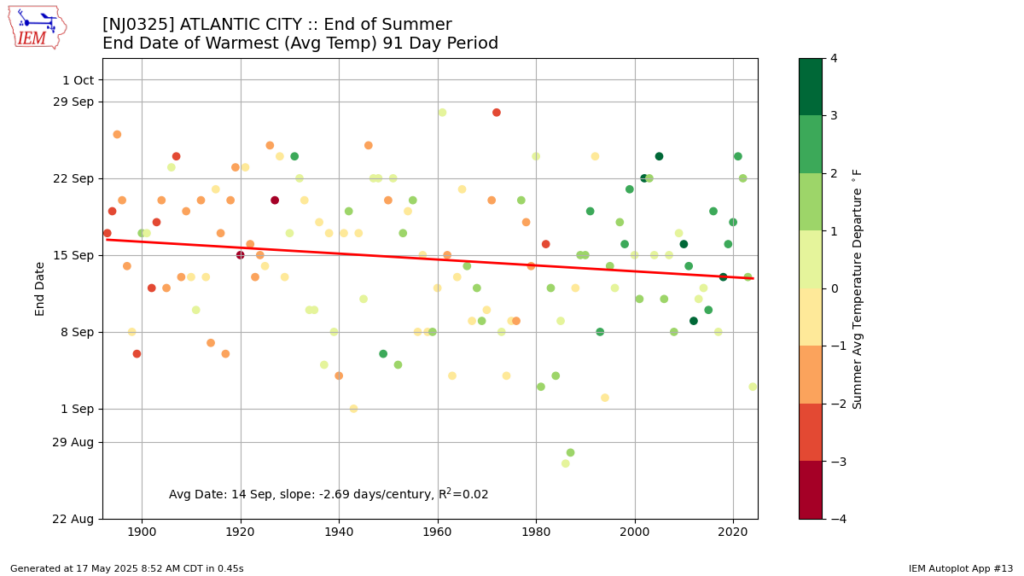
    Interestingly, the warmest 91-day period of the year has shifted to slightly earlier over the decades. In Atlantic City, here’s the shift, according to the Iowa Environmental Mesonet.

    1900: June 17 to Sept. 16

    1980: June 15 to Sept. 14

    2020: June 14 to Sept. 13

    The average temperature during climatological summer – June through August – increased by 0.65 degrees between 2010 and 2020 in southeastern New Jersey, according to ClimateCentral. Since 1904, the average summer temperature has increased from 71.0 to 74.0 degrees, per NOAA.

    So where can you find true beach weather on Memorial Day?

    Long-term weather averages say that once you go south to Virginia Beach, Va., average high temperatures reach at or above 75 degrees, according to NOAA. That being said, the beaches are better in Jersey, from what I hear.

    Have a great Memorial Day weekend everyone, happy unofficial start to summer and let’s remember all of our fallen United States military members. It’s why we have Memorial Day in the first place.

    Joe Martucci, a Certified Broadcast Meteorologist and Digital Meteorologist, is the President and Director of Meteorology for Cup A Joe Weather and Drone. You can connect with him at cupajoe.sparkable.opalstacked.com/.
  • Jones Road Fire shows how fragile NJ’s Pine Barrens are

    Jones Road Fire shows how fragile NJ’s Pine Barrens are

    The article initially appeared in Shore Local Magazine on May 1. Find it here.
    By Meteorologist Joe Martucci

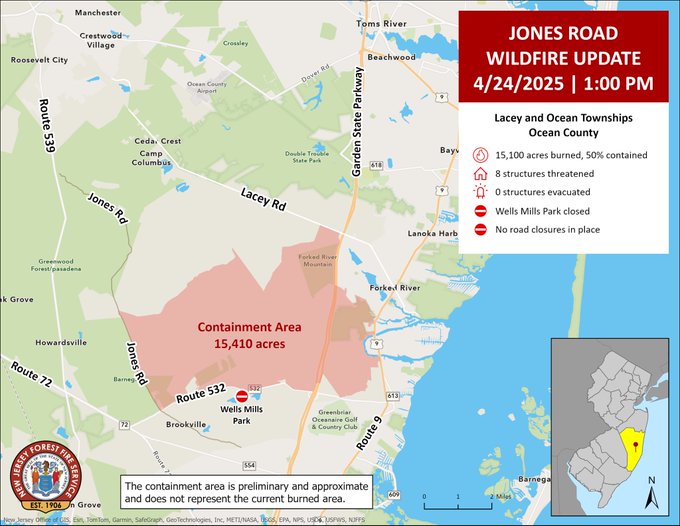
    The Jones Road Fire, which was first spotted at 9:45 a.m. on April 22, was New Jersey’s largest wildfire in 18 years, swallowing up 23 square miles in Ocean County, or a little over 15,000 acres.

    While drought conditions have improved across the area, the fire is a stark reminder that we are in the midst of a wildfire season that has big potential to be severe, if we are not careful.

    Jones Road Wildfire update from 4/24, near the peak of the fire (New Jersey Forest Fire Service)

    The Pine Barrens is such a unique landscape that maybe we take it for granted. You learn about it in elementary school, and you might even be told about the Jersey Devil (whose home is in Galloway, according to legend).

    In Meteorology School at Rutgers University, you learn the sandy soil makes it cool off quickly at night. Its composition makes it perfect for growing cranberries and blueberries. The forest is so dense, that satellite imagery shows this as a noticeably darker area than the rest of the state.

    All that dense forest means one fire can spread quickly. Any forest that has dry ground with low humidity and a gusty wind can increase the size of the blaze. However, the New Jersey Pine Barrens, specifically, have a few factors that make this area uniquely prone to to fine.

    Pitch pine

    Pitch pine, which the region gets its Pine Barrens name from, is highly flammable. The needles and bark ignite easily.

    Quickly drying soil

    The sandy soil of the Pinelands, known as sugar soil to the locals, drains water quickly. Think of sand on the beach. You pour a bucket of water on it and a few minutes later, that wet spot pretty much dries out.

    The same is true in the Pinelands. The ground dries out faster than most forests. The old adage that it will rain overnight, and you’ll have wildfire by noon is based on this truth. This year’s drought only amplifies that.

    Topography and wind

    The Pine Barrens in New Jersey are flat, like a big, open field. The trees there aren’t very tall, and their tops (called the canopy) have lots of gaps. This makes fires spread really fast.

    Because the trees are shorter, wind from above can blow down to the ground where the fire is, without getting blocked like in other forests with taller trees.

    Forest next to people

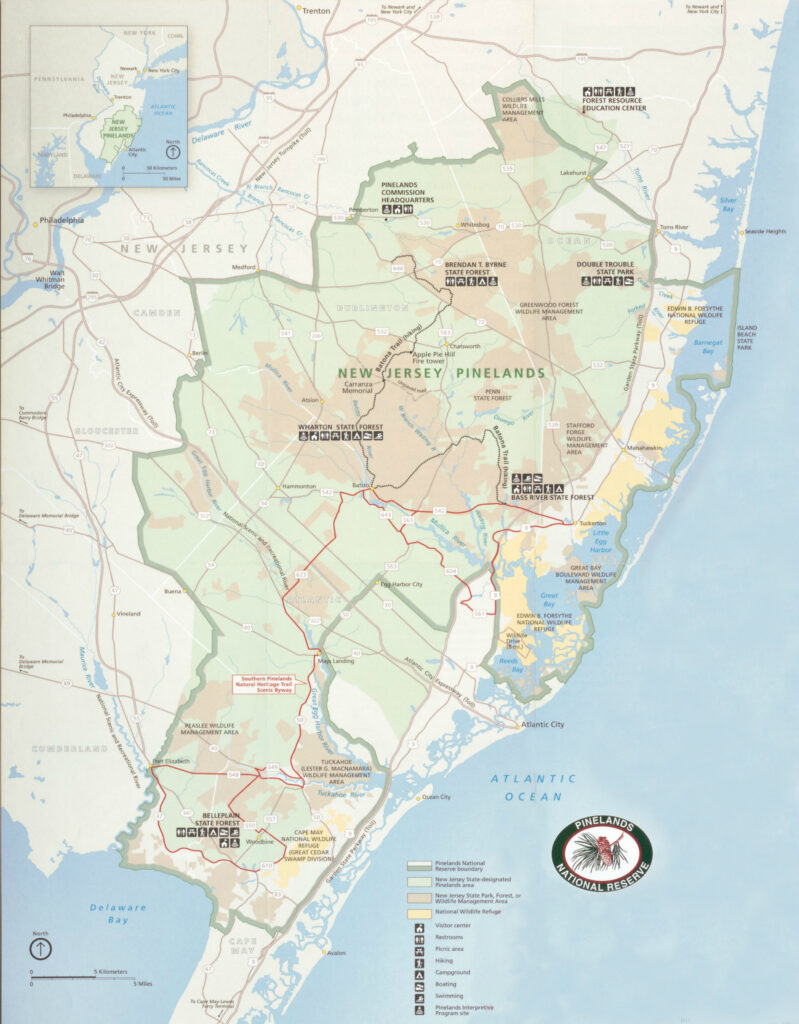
    Map of New Jersey, with the Pinelands National Reserve in the green outline. (State of New Jersey)

    The Garden State Parkway is like a big boundary line in New Jersey. It separates the wild, state-protected Pinelands Area to the west from towns and cities to the east.

    In Ocean County, starting at Toms River and going south, the west side of the Parkway is the Pinelands, while the east side has homes, stores, and businesses.

    The Jones Road Fire happened in Ocean County. In Atlantic County, the Parkway separates the Pinelands from developed areas until about Mays Landing. In Cape May County, the Pinelands National Reserve follows the Parkway from Marmora down to around Swainton and Goshen.

    You don’t have to go far from the Pinelands to find busy places! In Ocean County, right across the Parkway, there are huge neighborhoods with lots of houses. In Lacey Township and Ocean Township, where the Jones Road Fire burned, over 35,000 people live with homes, shops, and more, just a short distance from the forest.

    Plus, you have to consider the Garden State Parkway running through there. In 2018, 389 million toll transactions took place on the road, according to NJ.com. When the Parkway closes, it backs up traffic and slows the local economy.

    Last Tuesday, I had to go north, through the Jones Road Fire on the Parkway. I was diverted onto County Road 539 in Ocean County.

    Thankfully, the traffic was moving north. However, going south on that one lane it was bumper-to-bumper traffic for miles. It’s an issue which could happen in the South Jersey shore area, too.

    This drought plays a role

    As of April 25, 662 wildfires have occurred in New Jersey this year – 16,572 acres burned, the vast majority of that the Jones Road Fire.

    Last year through by April 25, about half as many wildfires occurred, burning just 315 acres.

    The difference is drought. When the Jones Road Fire began, that area was in a transitionary state between drought and no drought, known as abnormally dry conditions, according to the United States Drought Monitor.

    All of Atlantic and nearly all of Cape May counties were officially in drought. Plus, the New Jersey Department of Environmental Protection put forth a drought warning for the state in November.

    Drought means, among other things, the ground is dry, and the water table is lower. This only enhanced the spread of wildfire.

    There has been no wetter-than-average month in 2025. Statewide, it was the third driest January on record, according to the Office of the New Jersey State Climatologist (0.92 inch average).

    February was below average, too. March then bucked the trend, with nearly average precipitation. April should come in around the same (not known at the time of writing).

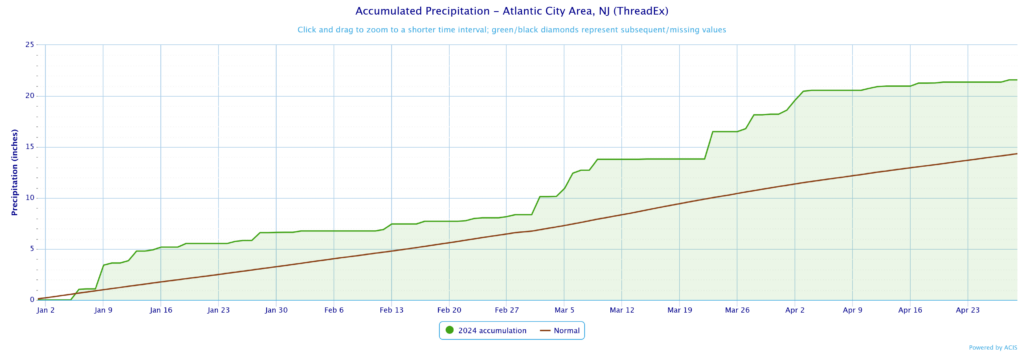
    Last year was nearly the opposite. It was the wettest start of the year, on record, through April 25, at Atlantic City International Airport, according to the National Oceanic and Atmospheric Administration. Located on the edge of the Pine Barrens, it’s a good indicator for the South Jersey Pinelands.

    Precipitation accumulated for Atlantic City International Airport in Egg Harbor Township from January 1 to April 25, 2024. Last year was the wettest start to the year, on record, up to April 25.

    In Hammonton, farther into the Pine Barrens, it was the sixth wettest. Records have been kept fairly regularly since 1893.

    As long as drought continues, and I believe it will in Atlantic and Cape May counties into the summer, the potential for another Jones Road Fire is higher than usual.

    You can prevent wildfires

    About 85% of wildfires in the United States are caused by humans, according to the United States Forest Service. Fire is a natural and needed part of our ecosystem. However, humans disrupt Mother Nature’s rhythm, which would typically happen from lightning strikes.

    No published research has been done in New Jersey, but in California, researchers found that human-sparked wildfires spread more than twice as fast as lightning-induced burns, according to the University of California-Irvine.

    What Smokey Bear first said in 1944 holds true in 2025, “Only you can prevent forest fires.”